Why the $1580 (US) level in Gold is important (to me).
Weekly Gold Chart (my platform and my analysis).
I’m thinking the April high of $1580 as support which coincides with:
1. Line of trend support drawn from January low of $1308 .
2. Red 30 week Simple Moving Average line which has been defining support since January 2009.
3. Yellow Weekly RSI (7) in its historical turn zone (45).
Every time parameters 1 to 3 have lined up above she has bottomed PLUS, as a bonus $1580 was the level of April resistance
This could well overshoot in these crazy times, where the majority of world banks are insolvent (not just Lehmann) and the governments are in debt up to their eyeballs but its already corrected a healthy 15%. With the banking sector insolvent methinks there is real need for a 'real' safe haven
(click on charts to expand to see the nitty gritty)
Zoom in:
Well, it appears that $1580 is holding. Chart Update:
I've added a 40week (approx 200day) Moving Average to the chart (yellow line), where gold bounced off following my last post on the subject.
I think that Gold could have some downside before its run as a 'safe haven' ala 2008. For no reason other that I feel that when the global financial shit really hits the fan, fund managers will liquidate everything as they have to meet investor redemptions.
Technical Targets (prices in US Dollars per Ounce)
Fibbonacci numbers in blue are from Major Bull Run October 2008 to early Sep 2011 ($682 to $1921)
Fibbonacci numbers in purple are from Minor Bear Fall early Sep 2011 to late Sep 2011 ($1921 to $1532)
$1837USD Fib 78.6%
$1772USD Fib 61.8%
$1726USD Fib 50% (This is a biggie to be breached)
$1680USD Fib 38.2% (This was tested and held as Resistance on 4th October)
Current price as I write $1650
$1628USD Fib 23.6%
$1624USD Fib 23.6% (Pivotal area in the bull/bear tussle)
$1600USD 30 wk Moving Avge (On Chart, this was tested and held as Support on 4th/5th Oct)
$1548USD 40 wk Moving Avge (On Chart, this gets breached and next level down will get tested)
$1447USD Fib 38.2%$1301USD Fib 50% Extreme bottom Support IMO, I can't see this breached unless the impending depression gets 'fixed' by some miracle or war (like WW2 'fixed' the 1930s depression) etc.
Another Gold blogger I discovered last week is also fan of $1580. Gold Trading Desk.
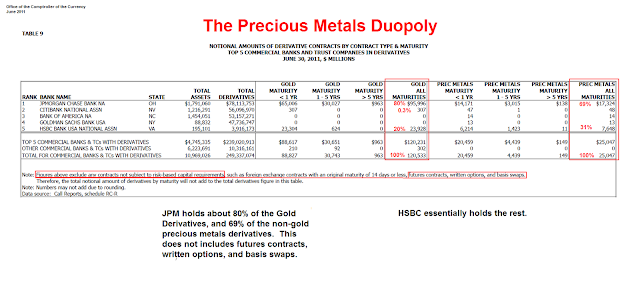
PS Want to know who is the main suppressor of Gold? JP Morgan mainly and HSBC to a smaller scale. These figures below are in millions. JPM has $1.79Trillion in assets and $78Trillion in derivatives exposure, 43x its assets and over 1.3x the GDP of the whole world.
(click on pic to expand)


1.3 times world GDP!?
ReplyDeleteIt's okay because they're American.
If they were European there'd be a huge fuss.
Jesse,
ReplyDeleteHave you ever dropped by FOFOA's blog?
Thanks hombre.
ReplyDeleteHere is the link visitors...
http://fofoa.blogspot.com/
I've been visiting FOFOA for a while, a good blog.
ReplyDeleteI've thrown it in the links. Thanks mateys.
ReplyDeleteOh well, we have 3 weeks to stock the larder and build the revetments until the Merkozy miracle.