Wednesday 31 August 2011

Hi Ho Silver #2


I post Hi Ho Silver in May where Peter Schiff was talking $50.

Yesterday Dr Alex Cowie put forward his arguments in a piece titled Silver may be better bet than gold.

Both gold and silver have made big moves higher so far this year, but silver’s gains of more than 30% year to date are more impressive than gold’s 25% climb and, likely, will continue to be.

“Own gold and silver as soon as you can,” Alex Cowie, editor of Diggers and Drillers, said in a recent report for Daily Reckoning Australia. But “I would choose silver over gold.”

Why?

According to Cowie, the Commitment of Traders report “says buy silver.” The fewer open positions on silver there are, the more bullish the set up because there are “loads of potential buyers out there who haven’t entered the market,” he explained.

The gold-to-silver ratio also favors silver, he said. Gold is roughly 15 times more rare than silver in nature and right now, you need about 44 ounces of silver to buy one ounce of gold. That ratio is heading back to where it belongs and could close in on its long-term mean of 15. At the same time, there’s no more silver to spare and investment demand for the white metal is soaring, said Cowie.

“There isn’t even enough silver bullion in the world to supply one ounce per Chinese citizen,” he said. “It doesn’t take much imagination to see where this is heading.”

A GoldSilver Ratio of 15 puts Silver at $120 based on Gold's current price.

A swath of GoldSilver charts can be found here: Gold Silver Ratio History Charts

On that other barbarous relic....American now prefer Gold over Stocks and Real Estate as long term investment. As the US Fed and other Central Banksters continue to keep interest rates at zero or negative*, the relics won't lose their lustre as a safe haven.


*Bank of New York Mellon Corp. on Thursday took the extraordinary step of telling large clients it will charge them to hold cash.

*ZURICH—In a sign of mounting tension caused by the strong Swiss franc, UBS AG said it may begin levying a temporary charge on Swiss franc deposits as a way of encouraging other banks to limit the cash they keep in the surging currency.

Monday 29 August 2011

Gigglin' Goths

(pics courtesy of "Asterix And The Goths")

Bailout of PIIGSUK Going To Plan:


Bailout NOT going to plan:


German Chancellor Angela Merkel no longer has enough coalition votes in the Bundestag to secure backing for Europe's revamped rescue machinery, threatening a consitutional crisis in Germany and a fresh eruption of the euro debt saga.


I have discussed this here, here, here, here, here, here (banks on the hoof on this one) and more. Its not rocket science, source your information well and be prudent with that you can't lose and ride the trend with that you can.

Mrs Merkel has cancelled a high-profile trip to Russia on September 7, the crucial day when the package goes to the Bundestag and the country's constitutional court rules on the legality of the EU's bail-out machinery.

If the court rules that the €440bn rescue fund (EFSF) breaches Treaty law or undermines German fiscal sovereignty, it risks setting off an instant brushfire across monetary union.

The seething discontent in Germany over Europe's debt crisis has spread to all the key institutions of the state. "Hysteria is sweeping Germany " said Klaus Regling, the EFSF's director.

German media reported that the latest tally of votes in the Bundestag shows that 23 members from Mrs Merkel's own coalition plan to vote against the package, including twelve of the 44 members of Bavaria's Social Christians (CSU). This may force the Chancellor to rely on opposition votes, risking a government collapse.

Christian Wulff, Germany's president, stunned the country last week by accusing the European Central Bank of going "far beyond its mandate" with mass purchases of Spanish and Italian debt, and warning that the Europe's headlong rush towards fiscal union stikes at the "very core" of democracy.

Friday 26 August 2011

A Barbarous Relic

(Gold as referred to by King of Economic buffoons - John Maynard Keynes in 1924)


The stock market and real estate spruikers are calling gold as a bubble.

Lets go back to 1980.

Dow Jones (INDU): 875 (today 11,149), a gain of 8.55% per annum over 31 years.

GOLD: $704 (today $1765), a gain of 3.00% per annum over 31 years.


(click on chart to enlargen)


The first few years of the 1980s were characterised by high inflation globally (10%+).

In Australia inflation has averaged 4.4% pa over 31 years (you can check historical inflation here). Which is about right globally.

Based on 4.4% inflation, a fair price today for GOLD from 1980 mega peak is $2674, call it bubbly then (maybe!).

Maybe?

I'll get bubble conscious when the Dow:Gold ratio is <2.0 (eg $2500Gold,5000DJIA).

The current global overleveraged debt situation makes the 1920s look benign. Maybe even go 1:1?

Dow:Gold chart.


Lets face facts, over the last 10 years if you were exposed to the broader share market index (such as High Growth superannuation) you've had a lost decade, you haven't made a razoo. Zero. Nix. Nada.*

If you bought Gold 10 years ago you made around 20% pa in USD and around 13% pa in AUD.

Current DowGold ratio is around 6.2. On its path to <2.0 is Dow going to fall, Gold rise, or both? I'd say the latter and it could take up to another 10 years of grinding lower stocks and rising gold.

*Aussie Stocks (All Ordinaries index) have risen at the dizzy average return of 2.2%pa (thats two decimal two - less than inflation) over the last 10 years.

Back to Keynes. In the modern era, his most voiciferous acolyte, is mega-fuckup Paul Krugman, advisor to governments. He won the Nobel prize for economics in 2008. His most famous quote is below. With bone smokers like that being taken seriously where do you think the barbarous relic is headed?


Down, Down, Deeper and Down.

I want all the world to see
To see you’re laughing
And you’re laughing at me
I can take it all from you
Again again again again again again again
Deeper and down
Down down deeper and down
Get down deeper and down


No, I'm not showing my age (well I am). Its about Real Estate.

I was spurred by the post on macrobusiness, Perth takes another hit.

Most of the far flung states are. I live in QLD and thats a basket case as described in the anecdotes in LVO's, Messages from the front-line  .


(pic sourced from macrobusiness link above)

I just flew in from Hobart after flying into Launy and driving around the state, and whilst its not in full crash mode yet, one can sense it. If you want to make a quid down there make Real Estate "for sale' signs, half the state is on the market it seems, but frozen, nothing moving.

In fact, I almost swerved into the D'Etrecasteaux Channel when cruising down Bruny Island, the radio station bimbo in a jubilant tone blurts out (as news) that in 'excellent' figures 'just out' - 45,000 of the states workers were employed in Real Estate and Construction and a third of the governments tax revenue comes from Real Estate transactions (ie Stamp Duty).

Is that a problem? Well, in census 2006 there were 216,000 Tasmanians in the labour force, its 5 year old census data but 45,000 in the RE industry is a number around 20% of the workforce. As for the govts gravy train via stamp duty slowing to a few brown spots on the table cloth, the govt of Tasmania is about to dump 1700 public servants and the shit hasn't really hit the fan...yet. With that level of the workforce in the Ponzi (Ireland and Spain like ratios) I see some dark times ahead not only for the apple isle but the whole nation...


I was having a Boags Wizard Ale with an old mate that I hadn't seen in 20 years. Told him I was contemplating moving to Hobart. "When?" He asks. "When I can buy a house for less than 50% of their current value, say 2014 or 2015" [cue choking and beer spraying].

I have to stop saying shit like that when folks are mid sip/gulp.


Australia: Red/Orange  USA: Blue


(graph from Who Crashed The Economy before I drew the lines )     


Notice on the graph that folks that bought in the big Australian house bubble of 1892 didn't get their money back until 1950 (their great great grandkids anyway)?

Danger! Danger!


A very short while ago Bernank-the-Wank didn't give the stock market the free ice cream it was hoping for at Jackson's Hole. We apologise for the disruption to the program and we return you back to the shrinking economies, credit cooling and deleveraging crisis.

This caught my eye in the London Telegraph: Market crash 'could hit within weeks', warn bankers.

A more severe crash than the one triggered by the collapse of Lehman Brothers could be on the way, according to alarm signals in the credit markets.


Got that?

Insurance on the debt of several major European banks has now hit historic levels, higher even than those recorded during financial crisis caused by the US financial group's implosion nearly three years ago.

Credit default swaps on the bonds of Royal Bank of Scotland, BNP Paribas, Deutsche Bank and Intesa Sanpaolo, among others, flashed warning signals on Wednesday. Credit default swaps (CDS) on RBS were trading at 343.54 basis points, meaning the annual cost to insure £10m of the state-backed lender's bonds against default is now £343,540.

The cost of insuring RBS bonds is now higher than before the taxpayer was forced to step in and rescue the bank in October 2008, and shows the recent dramatic downturn in sentiment among credit investors towards banks.

"The problem is a shortage of liquidity – that is what is causing the problems with the banks. It feels exactly as it felt in 2008," said one senior London-based bank executive.

Its not a liquidity problem. The greedy bastards haven't retained enough capital. As I've written earlier some are insolvent. Zombie institutions.

"I think we are heading for a market shock in September or October that will match anything we have ever seen before," said a senior credit banker at a major European bank.
Got it. Loud and clear.

Wheres the popcorn?


I've heard that some superannuants approaching retirement (ones not in Cash and Fixed Interest)
 start smelling like fish.


Monday 15 August 2011

Short Break In Tassie

Am in Tassie on holiday until end of August. Irreverent and disrespectful commentary on clove footed herbivores, financial commentators and the idiots that we elect (and the bankers that actually run the show, that we don't elect) will resume when I get back. So far Launceston strikes me as a large dose of Nova Scotia, a touch of New Zealand, friendly charm and as bonus everyone is related. That extra finger comes in handy, it seems, when one is picking up empty beer glasses. My first iPhone post! Time to celebrate...

Thursday 11 August 2011

In A Good Position With Sound Fundamentals

(h/t Tasmanianrealestate Trouble for the pic, all your pics are hilarious mate)


Good positions and sound fundamentals, blah blah blah....apparently thats Australia.

So says that bloke Penny Wong, the village idiot Swan, the Redhead that runs those clowns, and every nodding, waffling, talking 'expert' (def: has-been drip under pressure) on Sky Biz Channel and Mainstream news and current affairs.

  • No mention of the nett $650B+ the banks owe overseas so they could fuel the property bubble,
  • No mention of the well over $1Trillion borrowed by wildebeeste to fund mortgages that are only worth half of that ammount.
  • No mention of the fact that Bank of America, Societe Generale, Uni Credit etc are dead banks walking.

Plenty of lies about global recovery etc, its just a pity the G20 economies are shrinking.

We (bloggers aplenty) have written ad nauseam that when property bubbles burst unemployment lags initial falls in prices and then it becomes a feedback loop aka death spiral. So in the car just before, on ABC Newsradio, the lemming reported that Unemployment UNEXPECTEDLY rose in Australia and it surprised many experts and economists.

Unexpected (?), are you fucking joking? Are these the same spruikers that bullshit about fundamentals on the Biz channel, ABC news (wink) and lateline etc? Wildebeeste in glossy coats.

One more time...Unemployment lags property falls and THEN feeds it
USA:


Ireland:
(h/t Unconventional Economist @ Macrobusiness for the bottom three charts).

Spain:


United Kingdom:


Secretly Broke In Australia.

Was most surprised to read Mike Shedlock in the USA (one smart cookie who reads it accurately and tells it like it his - I have a link to Globaleconomicanalysis on the right of the blog in the links) adding another chapter to his routine analysis of the bucket of shit that is the Australian Housing Market.

His post, Secrtely Broke in Australia, is brilliant.

The housing boom in Australia is now an escalating bust. Many Australian homeowners put every cent they had into their homes and they needed double incomes to just scrape by. Unfortunately, those jobs are disappearing in a construction and commercial real estate bust.
I warned about this event for years, but in Australia, like everywhere else "It's Different Here" until it's not.

60 Minutes Australia picked up the Secretly Broke story in "
The Big Squeeze". Click on link for a 60 Minutes video. Here is a partial transcript.


ALLISON LANGDON: To the world, Tracy and David Dodd are the very model of Australia’s relaxed and comfortable middle-class. They’re living the dream – three kids, a mortgage and a suburban family home on an acre block. But Tracey and David have been keeping a secret from their family and friends – they’re drowning in debt. No-one to look at you would think that you are struggling.

TRACY: It might look like we have got everything but you don’t see the mortgage, you don’t see the loans. You don’t see everything and nobody wants to talk about it you know, because it is embarrassing.


ALLISON LANGDON: Has it taken a toll on you both?

TRACY: Mmm…sorry.

DAVID: Oh it has – it has taken its toll but you’ve just got to do it.

ALLISON LANGDON: Like most young couples, the Dodds invested their heart and soul and every spare cent they had into the ideal of home ownership – the biggest mortgage their double income would allow. But last June, Tracy lost her job in the construction industry and David was made redundant. Just to keep money coming in, he’s taken a lower-paying job. Ever since, the Dodds, like tens of thousands of middle class families have been going secretly broke in the suburbs.

TRACY: We went from having a really great income including a company car, fuel card, phone – things like that – to basically losing all of that.

ALLISON LANGDON: So do you have more money going out each week than what you’ve got coming in?

TRACY: Absolutely.

ALLISON LANGDON: How much difference are we talking about?

TRACY: Probably – it’s getting very embarrassing – probably about 400 bucks…$400

I suggest you read MiSh's full post and watch the 60 mins story linked in the post.

They are forking out $400 more each week than they earn, $20,800 a year. Probably off Credit Card.

This is worse that I thought, its not just a ticking bomb, its a financial nuke.

What about this comment (you HAVE to sign up for the Ponzi and enter debt peonage/slavery)?


DAVID: Oh it has – it has taken its toll but you’ve just got to do it.


Just like the following Wildebeeste have to cross the river at this very point because the ones ahead have shown the way.


They just HAVE TO.


Wednesday 10 August 2011

Slipstream's ASX Updates - Where To From Here?


Wider Screen?

SlipStream Trader Updates and History.

Running Up The Down Escalator

Bear Market Rallies

 
Between Sep 2008 and March 2009, the ASX had 5 x 400pt+ multiday rallies.

 
In fact 4 days after Lehmann Bros collapsed the market added 500pts in a couple of days.

 
Overall? The ASX dumped 2000 pts in 6 months around those rallies.

 
Best illustrated by the Nikkei which has dumped 75% over 22 years.


If the ASX followed the above pattern it will be 1700 in 2029 (cue shrieking and self harm).

 
Hows your High Growth Super looking? (I'm the guy in orange on the vid ;)


Its a high volatility bear market.

The algo trading platforms (75% of NYSE volume) and the swing and trend traders will make a killing.

The equity oriented superannuant IS the kill.

ASX since 2007:
  • down 53%,
  • then up 56% on "US Fed QE stimulus" (still down 27% overall from 2007),
  • then a current leg down of 16% (down 39% overall from 2007).
See the Big Picture Trend?

Tuesday 9 August 2011

Look At The Bright Side


On the weekend I wrote:

Positions: I rarely go into a weekend with open FX positions but this weekend I am short AUDJPY, GBPJPY, EURCHF and Suncorp (what a lemon) all deep in the money, I have no bullish positions at the moment but am trying to find a good entry to long a Gold contract.

In June I wrote a post called Special Relationships, and that 'special' relationship was never truer in the equity bloodbath over the last two days. And what about Suncorp? Into the abyss.


I've  been whistling a little Nat King Cole tune:


“Red sails in the sunset, way out on the sea.
Oh, carry the bull’s money...home safely to me
She sailed at the dawning, all day its been poo.
Red sails in the sunset, I’m trusting in you.”
(apologies to the memory of Nat King Cole)


NB. The thing to watch in this trade, is Bank Of Japan currency interventions, they always fail, but every few days tighten your stops take the profit and short again after the intervention as it rolls off the top.


I also wrote on Super Assets:

So in 4 years, Cash is ahead of inflation by 6.5%, ahead of High Growth by 38%. High Growth is 31.5% behind the inflation curve.......
  • When you lose 15% off your Super (approx 25year to go) thats an extra year or two you have to work to make that back (a loss of a single 15% this year equates to a payout of about $60,000 less in 20 years and $80,000 less in 25 years).
The bright sides? These folk in "high growth" are going to be remaining the workforce for years so their goes the so called "skills shortages".

Also, the Baby Boomers getting their super smashed will be dumping their investment properties very soon methinks, so maybe some "Irish Discounting" (-50% over 4 years) to get that retirement property in 2014/2015?

10 year returns since 2001:
Equities (high growth): +18.6% (a princely average annual return of 1.7%)
Gold (in AUD): +216%
Cash: +79% (annual 6% assumed)


I quoted on Gold...

A simple correlation rule of thumb allows us to predict that gold will be at $1,950 by the end of the year if it simply retains it close correlation to the debt ceiling. Should Bernanke announce that he will additionally need to monetize some or all of this incremental debt amount, we anticipate that gold will be well over $2,000 by the end of the year, courtesy of yet another round of accelerated dollar debasement

At +$120 in two days it might get there in a month!


European Kleptocracy.

The ECB spent a gazillion and bought Spanish and Italian bonds and boom went the market (for 55 minutes).

That Bond buy (ECB slurping Spanish and Italian slop) was a travesty. All it did was mega boost Spanish and Italian banks (temporarily). Lending money as a last resort to severly indebted entities to boost bank balance sheets. The ECB should change its name to Banking Bastards Cabal LLC Inc.

Why? A couple of banks are fucked.
ECB's new policy statement:

“We’ll continue to look after our banking masters, socializing their losses until we have exhausted all capital (and YOU are rooted, bankrupt and our bonds are rated CC-) and we’ll reduce your personal freedoms even more in the process”

Time for some levity.


Sunday 7 August 2011

"Now does my project gather to a head"

(Prospero uttering the opening line of Act V (the Final Act) of Shakespeare's The Tempest (circa 1610-11))


Its all coming together. Standard and Poors and the German government make strange bed fellows but c'est la vie.

The US Problem.

If you haven't heard about USA's credit rating being downgraded to AA+ (same as Belgium and New Zealand) you've spent the last 48 hours asleep.

We'll keep to a simple picture. The two structures to the right comprised stacked $100 bills (100s not 1s!), the $15Trillion 'short' structure is the US Debt, the $114.5 Trillion 'tall' structure is its unfunded liabilities (Medicare, Social Security, Govt Pension Plans, Military etc it is the money the US knows it hasn't got to pay its bills and you can see it tickover in the bottom line here: http://www.usdebtclock.org/


(click on pic to enlarge)


Some commentators are calling it the "Teaparty Downgrade" after the right wing nutters that control the Republican dominated congress. The movement that refuses to cut military spending and increase taxes on the rich. They believe that cuts should be implemented against the average Joe in the street, the Joe that borrows and spends and keeps the economy growing. Did someone say Depression?

Some perspectives on taxation and military spending are called for.

Tax rates on the super rich. Buffett blasts system that lets him pay less tax than secretary.

Speaking at a $4,600-a-seat fundraiser in New York for Senator Hillary Clinton, Mr Buffett, who is worth an estimated $52 billion (£26 billion), said: “The 400 of us [here] pay a lower part of our income in taxes than our receptionists do, or our cleaning ladies, for that matter. If you’re in the luckiest 1 per cent of humanity, you owe it to the rest of humanity to think about the other 99 per cent.”


Mr Buffett said that he was taxed at 17.7 per cent on the $46 million he made last year, without trying to avoid paying higher taxes, while his secretary, who earned $60,000, was taxed at 30 per cent
.
17.7% without trying to evade/reduce tax? A problem?  Apparently not.

Without trying to draw links to the 'foreign policies' that saw the demise of the Roman Empire I draw your attention to the failed expeditionary invasions over the last 10 years. 225,000 killed (7.8 million displaced), $3.2T-$4T.


The human and economic costs of these wars will continue for decades, some costs not peaking until mid-century. Many of the wars’ costs are invisible to Americans, buried in a variety of budgets, and so have not been counted or assessed.  For example, while most people think the Pentagon war appropriations are equivalent to the wars’ budgetary costs, the true numbers are twice that, and the full economic cost of the wars much larger yet. Conservatively estimated, the war bills already paid and obligated to be paid are $3.2 trillion in constant dollars. A more reasonable estimate puts the number at nearly $4 trillion.

The German (Euro) Problem

As I predicted in earlier posts it appears the German's have realised that they are holding the can. It Just Went From Bad To Far, Far Worse As Germany Says Italy Is Too Big For EFSF To Save, Refuses To Carry Euro Bailout Burden.

Dow Jones just hitting the tape referencing Spiegel
  • German Govt: Italy Too Big For EFSF To Save - Spiegel
  • German Govt: Doubts Whether Tripling EFSF Would Help It Save Italy
  • German Govt: Italy Must Make Savings, Reforms To Exit Crisis - Spiegel
  • Italy Debt Guarantee Could Raise Doubts Over Germany's Finances - Spiegel
  • German Govt: EFSF Should Only Help Small, Mid-Size Countries - Spiegel
If Germany is now against this, which appears to be the case, it pretty much means, well, game over.


Add the uncerainty over the unwind of the Europe rescue "gamechanger" as one of the more naive CNBC anchors said yesterday, and Monday is now guaranteed to be a bloodbath.

 Out of Ammo

 Karen Maley is one of the sharper analysts at Business Spectator and she descibes the problem well. In GFC Act II (Act I was a decade of debt orgy) the governments of the world got into massive debts to 'stimulate' (aka kick the can down the road) economies in the hope that consumers will take up the baton and borrow and spend. It failed, now the governments are in debt and the consumers in debt. Is the global economy out of bullets?


Financial markets have realised that the major political achievements of the past three weeks – the eurozone’s latest bailout of Greece, and Washington’s debt ceiling deal – have done nothing to improve the bleak global economic outlook.
 
The US economy is faltering, as existing government stimulus programs taper off and the payroll tax break comes to an end. If anything, Washington’s debt deal has worsened the outlook. Some economists estimate that fiscal tightening is likely to shave about 1 percentage point off already stagnant US economic activity next year.

The eurozone, which is advocating a vigorous dose of austerity for its debt-laden members, is likely to see an even harsher decline in activity. The two largest eurozone countries, Germany and France, will both tighten fiscal policy in 2012, while harsh austerity programs will tip some of the southern eurozone countries into recession next year.
 
And even the Chinese growth engine is slowing slightly, as authorities battle with rising inflationary pressures which threaten to ignite social unrest

The problem is that governments in most developed countries have little option but to start embarking on a process of fiscal cut-backs. Years of deficit spending have left them with hugely bloated budgets, and soaring debt levels. As a result, they are under pressure to rein in their budget deficits, at a time when their economies are in desperate need of further stimulus.


Hats off Karen, a sound analysis in my opinion. And, pretty damned obvious. Although cut the Recession descriptor and go straight to Depression.

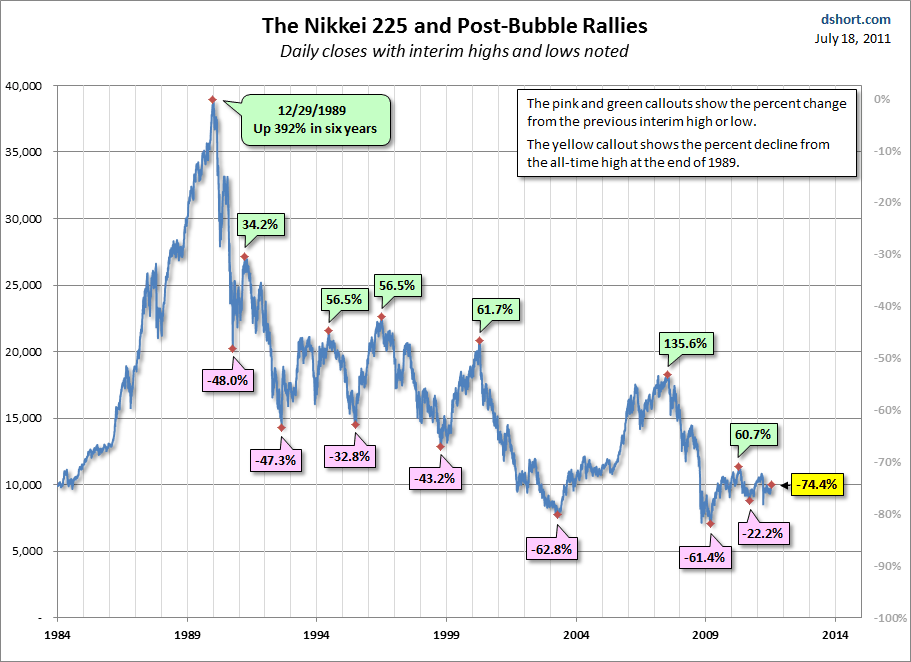
Has stimulus worked in previous Depressions? Never. Japan is still in the poop 22 years after its financial peak with its stock market hovering at around 25% of its 1990 highs.

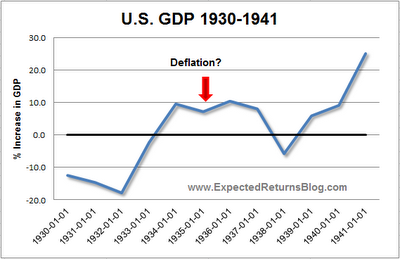
In the 1930s, Roosevelt implented "The New Deal" which stimulated the US economy from its depression whilst the US borrowed heavily. It then started to double dip and was saved by World War 2 (Gulp!) where from the late 1930s the US was on a war footing in manufacturing and supplying allies in Europe (and Germans, Dubya's grandfather), they didn't join until December 7, 1941.


Kondratieff Winter

Kondratieff Super Cycles last 60 years and cycle through Prosperity, Recession, Depression, Improvement aka Summer, Autumn, Winter and Spring. The modern cycle is closing on Winter. Modern Modifications of Kodratieff Theory.

(click on chart to expand)


The Kondratieff Winter is characterised by Deflation (a Deflationary Recession/Depression) it 'should' have started 10 years ago but the high borrowing and low interest rate policies of the USA has kicked the can and has created a situation where it will be prolonged and this extra credit and leveraging has now also got to be purged.

Deflation is quite simple. Sellers (houses, TVs, widgets etc) lower prices to attract a buyer whilst some resfpond many buyers hold off buying because it might be cheaper next week, sellers further lower prices and around it goes in a spiral.


Gold (the ultimate only(?) Safe Haven)

This ultimate safe haven was perceived to be US Treasuries (now longer AAA but AA+) and this article was written BEFORE the downgrade. The Imminent $2.5 Trillion Debt Ceiling Hike Will Unleash A Gold Price Surge To $1,950 And Higher.

A simple correlation rule of thumb allows us to predict that gold will be at $1,950 by the end of the year if it simply retains it close correlation to the debt ceiling. Should Bernanke announce that he will additionally need to monetize some or all of this incremental debt amount, we anticipate that gold will be well over $2,000 by the end of the year, courtesy of yet another round of accelerated dollar debasement, which also means that real gains in US stocks will be negated courtesy of the devaluation of the currency in which they are priced. The same, however, does not apply for gold, which with every passing day is priced in nothing but itself.
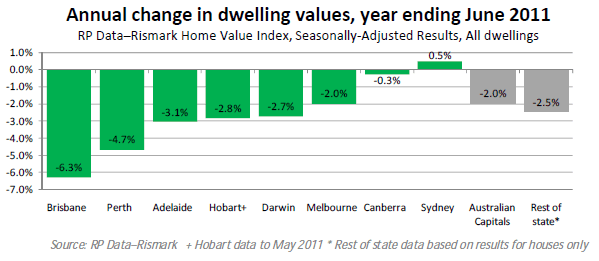


Australia (my 2c)

Australia is 4 years behind Spain.

You can’t have private debt @120% of GDP and ignore it especially if its backed by house prices. Further the banks are on the hock for a nett $680B to overseas lenders to support the property bubble.

Now slice say 20% off the underlying housing assets and lets stab at $250B written off. Add a good dose of global credit freeze (say TEDSPREAD >200), nice dash of state debt downgrades, and the only one left to bail out anything is Canberra with its AAA.

Now, do Canberra ‘borrow’ $200 or $300B thereby to inact some Krugman/Keynsian bollocks (that will fail anyway) that will put them in the Spain or Italy vicinity (total eternal debt to GDP circa 150%) clubs or just let the whole thing fail (Austrian) and rebuild after?

The elephant in the room is our massive (mostly private) debt to GDP its what keeps our economy alive (property ponzi feeding services and retail). Meanwhile the masses are fascinated by the Block and Masterchef and the politicians straight faced lie and wax lyrical. Yes Mr Swan Australia is a world away from Europe, just like Lehmann Bros was a Wall St firm a world away...until TEDSP spikes and global credit freezes. Then we are real close.

Notes: TEDSPREAD definition and what it implies. TEDSPREAD Definition and Meaning. and TEDSP:IND Graph


Super Assets (more offtrack observation)

As an aside I was bemused this week to read and hear in the MSM about punters fretting over their lost Super assets. Who the f&@* would have their retirement assets exposed to the stock market in these times where anyone with an IQ on the right side of the bell curve knows a Tsunami is brewing?

Plenty it seems. I came across very intelligent folk who have their super in 'High Growth'. Why is it called that? Why not call it "Have A Punt" or "Its All Been Put on Red". I ask these folk to ask themselves if the employer gave you $20,000 a year to invest would you put in a bank or the stock market?

In 4 years since the ASX was climbing with no end in sight and the US housing crash and global deleveraging storm was a nutters wish list (my super fund):

High Growth approx -19%
Cash +19%
Inflation +12.5%

So in 4 years, Cash is ahead of inflation by 6.5%, ahead of High Growth by 38%. High Growth is 31.5% behind the inflation curve.

  • $100,000 in 2007 is $119,000 today in Cash
  • $100,000 in 2007 is $81,000 today in High Growth
  • When you lose 50% in an asset you need to make 100% to get back to square 1.
  • When you lose 15% off your Super (approx 25year to go) thats an extra year or two you have to work to make that back (a loss of a single 15% this year equates to a payout of about $60,000 less in 20 years and $80,000 less in 25 years).

Positions: I rarely go into a weekend with open FX positions but this weekend I am short AUDJPY, GBPJPY, EURCHF and Suncorp (what a lemon) all deep in the money, I have no bullish positions at the moment but am trying to find a good entry to long a Gold contract.

  
Tomorrow Should Be A Hoot!!

Tuesday 2 August 2011

Too Easy Mr Stevens


Trading an RBA Rate decision.

Assumption on my part, rates on hold (or cut).

1425 AEST, set up a SellStop 0.02 below stable price...


If I thought the RBA could raise as well as hold, or cut, I would have set up a straddle, where a BuyStop is 0.2 above and a SellStop 0.2 below where One Cancels Other(OCO).

1434 AEST SellStop hit, account balance bubbling nicely (not expecting too much more maybe another 0.2 to 0.3 from the chart level to around 1.090 to 1.088).


Trading 101: SellStop
http://www.piptrader.com/type_of_orders.asp
Entry-Stop Sell Order
Entry-stop sell order enables you to place a sell order below the current market price. The order will become working order when the price is hit. For example, EUR/USD is trading at 1.2000/1.2003. You predict the price has a downtrend of 50 pips in the next 2 hours. If the price reaches 1.1150/1.1153, then the downside will transform into a momentum driven trade. However, your strategy or gut feeling tells you that if the price doesn't reach 1.1150 within 2 hours, upward movement is seen. In this situation, you would place an entry-stop sell order at 1.1150. If the price doesn't hit 1.1150 within your expected time, you can cancel the pending order.

Monday 1 August 2011

Nailing It!!

On Friday 22nd July after the Euroidiots bailout-to-fail I shorted the Euro against the Swiss Franc on a number of factors. I posted the weekend before the event, my observation about a posssible rush to swissie.

 If they both sell off the main money flow could be to the Swissie (Swiss Franc - CHF).

Edit
A follower emailed me a valid point:
You forgot , sine qua non currency - GOLD. The last man standing.
(thanks Paddy, very remiss of me)

I ended up shorting the pair 6 times (letting each position ride and adding to each aka "fading in") in 6 days.

The horizontal green dotted lines are each sell point, the red dotted line the last stop-loss (on all positions) as you can see at the time of editing the chart, the stop-loss is just a tad below my last short thereby locking in all profits. I ALWAYS use a trailing stop to lock in profits and tighten at key inflection or overbought/oversold.
(click on charge to enlarge)


Update. After I downloaded and edited that chart she fell even more from the 1.1202 level above to 1.1026   (-2% is a fortune in FX!!) and bounced up to hit my very tightended stop (x6 short positions) @ 1.1049 which happened to be the S3 Pivot Point (I'll explain pivots some other time).