Saturday 12 May 2012

The Fiscal Cliff


Heard of it yet? You will hear the term more often in the second half of 2012.

Cliff Dive?


AMERICANS have watched austerity sweep Europe with a certain Schadenfreude. But eight months from now they may get a dose of the same medicine. The political compromises that have produced much of America’s deficit of 8% of GDP are programmed to go into reverse at the end of the year, two months after the election. A stimulus package consisting of a payroll-tax cut, investment tax credit and enhanced unemployment insurance expires then, as do George W. Bush’s tax cuts (which have already been extended by two years from their original end-date of 2010). At the same time an automatic, across-the-board cut in domestic and defence spending, called a “sequester”, takes effect, cutting about $100 billion from government spending next year.

Why You Can't Ignore The Fiscal Cliff

In addition to the economic slowdown, the continued housing crisis, the endless turmoil in Europe and the deceleration in China and India, we are moving closer to the period where the so-called 'fiscal cliff' will become more of a threat to the market.  The fiscal cliff refers to the near-simultaneous January 2013 expiration of the Bush tax cuts, the payroll tax cuts, emergency unemployment benefits and the sequester established in last summer's debt limit agreement.  Various estimates have indicated that the hit to GDP could be as high as 4%. 
Various members of the Federal Reserve Board, including the Chairman, have been concerned enough to make their worries publically known.  Bernanke, at his last press conference, said that the size of the fiscal cliff was so large that "I think there's absolutely no chance that the Federal Reserve could or would have any ability whatsoever to offset the effect on the economy".

Chicago Fed president Charles Evans added that "The cliff at the end of this year is just that writ large.  Whether or not calm heads will prevail and avoid this or do something useful, you know that's as big an uncertainty as I can imagine anybody facing."  Atlanta Fed president Dennis Lockhart stated "Congress and the administration understand that the perception is growing that if a transition isn't engineered that works well, that you're going to end up with a lot of Mojo taken out of the economy in a very brief period of time."


Citi: The Fiscal Cliff Is 'SO RIDICULOUSLY LARGE'

The size of the so-called fiscal cliff at year end, which would unwind a decade’s worth of tax cuts and temporary income supports, is so “ridiculously” large relative to near- term growth prospects that markets may take some comfort in its scale. As Fed Chairman Bernanke warned Congress, the Fed would have “no chance” of offsetting an instantaneous shock so severe and noted he was “hoping” Congress would take action.

Really? Presidential election in November and the new Congress won't take office until January. They'll be hamstrung.


How Overpriced Is The Australian Housing Bubble?

81% or $184,000 according to Trendlines research.

http://www.trendlines.ca/free/economics/RealtyBubbleMonitor/RealtyBubbleMonitor.htm


That means a 45% haircut to get back to 'normal' prices. Japanese or American road to perdition?


Farage: The EU Titanic Has Hit The Iceberg

You'd have to have been visting Mars this week if you unaware that the Euro chickens are coming home to roost. I won't boringly hash over the details of the utter mess shrouding the mass theft.

Instead, we'll let Nigel Farage get straight to the point.


and, the entirely predictable is coming to fruition as far left and far right parties gain in popularity.


A Nation Of Loss Making Landlords


Napoleon* called England a nation of shopkeepers. Australians, on the other hand are a nation of loss-making landlords.
The Australian Taxation Office (ATO) has released its Taxation Statistics for the 2009-10 financial year, which  once again revealed that Australia is a nation of loss-making landlords.

According to the ATO, there were 1,751,679 property investors declared to the ATO in 2009-10 - representing one in seven taxpayers - an increase of 59,235 from the 2008-09 financial year.

Total losses on investment properties were $4.810 billion in 2009-10, or $2746 per property investor, down from $6.528 billion ($3857 per investor) in 2008-09.

Of the 1,751,679 property investors recorded by the ATO in 2009-10, 63% or 1,110,922 were "negatively geared", meaning that holding costs (eg, interest payments, maintenance, and other costs) outweighed income from rents.

Here is the kicker.

Of these negatively geared investors, nearly three-quarters earned less than $80,000 in 2009-10, and the average loss was $9132 per negatively geared investor, or $176 per week.

Not even higher income earners. Ponzi lemmings?

Not only are investment property holdings In Australia concentrated in lower-to-middle income groups, but also older age cohorts.

Wait until they really start dumping them to fund their retirements.


*Thanks Anon. I confused my recall of ambitious ex corporals (only a nickname for Bonaparte). Let history decide who is right, but at least if you read this blog you can't whine no one saw it coming.

Eric Sprott Discusses Gold Manipulation On CNBC


Hows that flag going?


Is it going to be a repeat of the 2008 flag?


Tuesday 1 May 2012

Gold Walks A Familiar Path


Gold Repeats A Prior Pattern


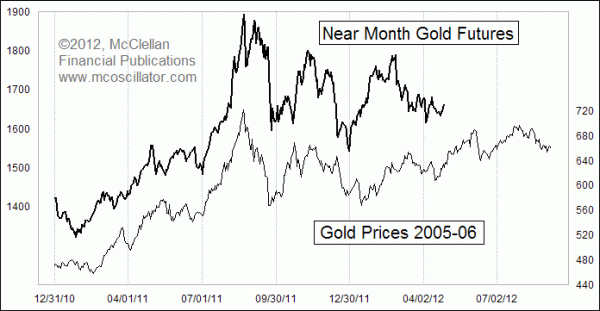
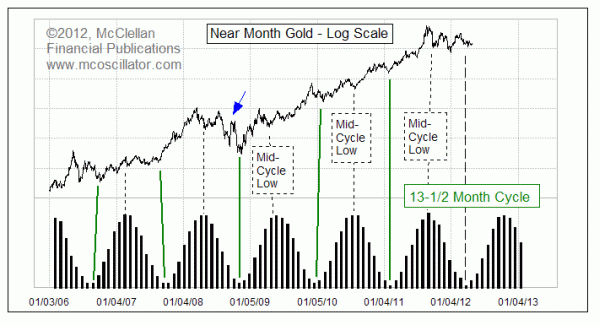
We are now entering the initial upward phase of the next iteration of this cycle, which is a period when big gains for gold prices are typically seen.  A few months from now, we'll get to worry about just how this cycle's important mid-cycle low might have an effect on gold prices, but that is not the issue to be concerned with at this time.  Instead, we want to locate the true major cycle bottom in gold prices, which can arrive a month early or late and still be considered "on time" in the history of this cycle.  We also want to catch the initial upward phase of the new cycle, which is when the biggest gains are usually seen.

Having the 2005-06 pattern as a guide can help us see where all the dance steps are from a complete prior instance, and let us see how the current market is following that rhythm.  If the current gold market follows those same dance steps, then we should see a nice rise up into a top due in early June, followed by another rise leading to a slightly higher top in late July.

The link is well worth a visit.

Gold Attacks And Manipulation


Last night I was looking at the Gold chart and SLAM! It recovered in the end but its getting silly.
Today's $1.24 Billion Targeted Gold Slam Down Makes The Mainstream Press

For the first time in what may be ages, a phenomenon that has become near and dear to anyone who trades gold, and which at best elicits a casual smirk from those who observe it several times daily, we find that the WSJ has finally picked up on the topic of the endless daily gold slam down, where the seller in complete disregard for market disruption (because in a normal world one wants to sell any given lot without notifying the market that one is selling so as to get a good price on the next lot... but not in the gold market where the seller slams the bid with reckless abandon) ignores market depth and in a demonstration of nothing but brute price manipulation force, slams every bid down just to demoralize further buying. Naturally, that this simply provides buyers with a more depressed price than is "fair" is lost on the seller, but not on the buyers who promptly bid up the metal as attempt to demoralize buying end in failure after failure. Yet it is peculiar that today, for the first time, the intraday gold slam down has finally made the MSM. To wit: "The CME Group Inc.’s Comex division recorded an unusually large transaction of 7,500 gold futures during one minute of trading at 8:31 a.m. EDT. The sale took out blocks of bids as large as 84 contracts in one fell swoop and cut prices down to $1,648.80 a troy ounce. The overall transaction was worth more than $1.24 billion... Gold traders buzzed with speculation that the transaction was an input error — a so-called “fat finger” trade. “Or a Gold Finger as it might be known in the bullion market,” traders at Citi joked in a note to clients." Well, no. It wasn't.

Because if it was, by that logic the gold market falls prey to a fat finger every single day, often times 2 or 3 times a day. But because gold market participants have learned that complaining to the CFTC about this kind of manipulation has no impact, and because at the end of the day it merely provides a cheap reentry price, most have grown to love and anticipate these kinds of moves. In fact, we can only hope that the CFTC and SEC ignores this WSJ update, and lets the market keep on keeping on without changing anything. Because otherwise who will provide the depressed price levels that permit conversion of worthless paper into Fed-detested, undilutable barbarous tradition?

Whistleblower Exposes JP Morgan's Silver Manipulation Scheme

On March 23, 2010, GATA Director Adrian Douglas was contacted by a
whistleblower by the name of Andrew Maguire. Maguire is a metals trader
in London. He has been told first-hand by traders working for
JPMorganChase that JPMorganChase manipulates the precious metals
markets, and they have bragged to how they making money doing so. 

CFTC Pulls Public Comments from JP Morgan Whistle-blower: “We Are Fearful of a Cascading Credit Event; Wide-Scale Market Collapse”

In the letter, the JP Morgan insider reveals that high level executives and traders at the bank are putting the investments and savings of thousands, if not millions, of hard working Americans at risk of complete wide-scale market collapse through their machinations and fraudulent practices. Moreover, he suggests that executives at his bank are fully aware of commodity manipulations in which the bank engages, as well as the risks posed by a European collapse, an event that, according to the whistle-blower, will lead to annihilation of investments within a matter of days. (letter in link above)

Metal$ are in the pits

There is no silver lining to the activities of JPMorgan Chase and HSBC in the precious-metals market here and in London, says a 40-year veteran of the metal pits.

The banks, which do the Federal Reserve's bidding in the metals markets, have long been the government's lead actors in keeping down the prices of gold and silver, according to a former Goldman Sachs trader working at the London Bullion Market Association.
Embry had this to say about the gold market:  “I would dare say that the manipulation (of gold) today is perhaps more blatant and there is more of it than I’ve ever seen.  They (the manipulators) don’t care anymore.  You see these 3 o’clock in the morning precipitous drops. 

You see drops when the COMEX opens and when the London PM fix is in.  There are always these times they attack, and no market that wasn’t being manipulated would trade with that regularity.

I am of the mind that the paper guys have overplayed their hand and they have pushed the price too low.  The people in the East, in particular, the Russians, the Chinese, etc., know perfectly well the situation.  They are using this as a wonderful opportunity to take on more and more physical at what I would consider to be bargain prices.

The RBA Have Hit The Button


Wow. Fear and Panic. Smell it.

RBA's 50-point rate cut shot in arm for non-mining economy

Non-mining economy? That other bit that measures 85% of Australia's GDP (the non-mining sector)?  The 98.2% of Australian workers not employed in mining? I thought it was a mining boom and Australian's benefited?

You have to laugh. No one saw this coming did they (Smells Like?)

David Collyer picked up on an interesting wee morsel last month that the media chose to ignore and bury (so they don't spook the herd), What a party; what a hangover!


The RBA said yesterday assets have fallen by $40,000 per household in the last year. 

What about the mining boom? The Ponzi scheme starts to unravel. $40K south in one year? Grab the popcorn.

No wonder everyone is now saving over ten percent of their incomes and slashing mortgage balances with grim determination.

The economy, which usually steers like an oil tanker, has turned on a dime.

We were spending about 103 per cent of incomes, pinching off some of the strong rises in home prices and balancing this with borrowings.

What happened? Falling land prices.

103% of incomes? What could possibly go wrong in an economy that relies on a property bubble and more debt for growth?

The ABS says house prices are down nationwide by a mere 4.8 per cent (ABS). This is the result.

ABS horseshit. The fact is you can drop your 2009 peak valuation by 15% and you won't get a buyer.

ABS stats from MacroBusiness


The magic number is 1.15% . Drop house prices by 1.15% per month and in 5 years they have halved in value, not allowing for inflation. The beauty of 1.15% is that the herd is by and large so stupid and sans a mathematical clue it appears to be an insignificant number to be ignored. That own goal is scored a lot sooner if we take the stagflation pill.

Now lets see what interest rate the banks pass on? My bet is very little as they need my deposit capital more than ever.

However, my bet shorting the AUD yesterday is off to the races. Fallen now 1.2% in 32 hours or 120% return on margin. Thanks Glenn.

RBA Links:
http://www.rba.gov.au/publications/fsr/index.html
http://www.rba.gov.au/publications/bulletin/2012/mar/3.html