Showing posts with label Australian Dollar. Show all posts

Wednesday, 3 October 2012

Australian Manufacturing Is Kaput


In the last half century the Australian economy has changed markedly in structure, these changes have changed the composition of Australia's employment base.


Manufacturing is measured by the Purchasing Manager's Index. Readings below 50 indicate contraction and above 50 expansion. Australian manufacturing continues its slide in recent data and the mainstream media has totally ignored it so where do we stand?
   
Canada   52.4  Expanding Slower
France   42.7  Contracting Faster
Greece  42.2  Contracting Slower (Gold Medal!)
Ireland   51.8  Expanding Faster
Spain     44.5  Contracting Slower
Switz     43.6  Contracting faster (Silver Medal)
UK        48.4  Contracting Faster
USA      51.5  Expanding (???!!!)

And, the land Downunder? The "Lucky Country"? 
AUSTRALIA 44.1 Contracting Faster (BRONZE to Australia!!!)

How are we going to bat our way out of this mess when the $USD remains subdued (and by default the $AUD high) through our No1 ally's US Federal Reserve continued money printing and currency debasement and policy of 'beggar thy neighbour'?

Now add in large falls in the Services Sector employment as house prices continue their slide and totally mad austerity policies by ideologically driven new governments in QLD, NSW and Victoria and what are we going to end up with?

Top it of with a mining sector cooling from THAT bubble in prices and lessening demand and what shall we get? 

A depression. 

Look at the bright side, the Irish manufacturing sector is now expanding. Just ignore the fact that their unemployment sits at 14.9% from its sub 5% lows in 2006 and house prices have fallen 50% in 6 years.
Hang on Paddy, we'll be there soon. 
Aust Pmi Sept 12 Web

Wednesday, 19 September 2012

The Printing Presses Are ON


Bernankenstein has finally caved to the vested interests and is going to start printing money again. This is going to be an end game move. Collapse of the US dollar?

Marc Faber on Bloomberg:


Gold and Oil

This is a must read:
BofA Sees Fed Assets Surpassing $5 Trillion By End Of 2014... Leading To $3350 Gold And $190 Crude

My commentary on Gold is bullish on this and you can confirm that here: Gold Tags.

Back on the 12th May 2012 I posted Eric Sprott Discusses Gold Manipulation On CNBC

Hows that flag going?


Is it going to be a repeat of the 2008 flag?

How did we go? BINGO! Now, will we see a consolidation pull back to say the high $1600s before continuing climb?

Weekly Gold 19th September 2012


QBAMCO argues for $15,000+ as an eventual price target (that makes me dizzy thinking about it) as posted in Perspectives On Gold's "Parabolic" Catch-Up Phase.
Were a USD devaluation and re-pegging to occur as of the end of 2014, following 2 ¼ years of $40 billion monthly MBS debt monetization, we estimate our Shadow Gold Price would approximate $15,000/ounce. (The SGP divides the quantity of USD base money by the quantity of US official gold holdings, as per the Bretton Woods monetary regime.) Over the weekend, Bank of America analysts implied USD base money inflation would increase much more than the Fed announced, to about $5 trillion by the end of 2014. This figure would imply an SGP a bit over $19,000/oz.

The Ridiculous Argument On $AUD Intervention

Meanwhile, bozos like Warwick McKibbin, ensconced in their ivory towers of academia complete with walls papered with failed economic theory and many associated sycophants, propose intervening in the Australian dollar. Here is a gem: How the RBA should clip the dollar

So what happens if we clip the dollar to to say 80c and Oil has jumped from around $100 a barrel to $200 a barrel? Australian consumers and the road transport industry paying over $3/Litre at the pump is what happens.

Sure the high $AUD hurts manufacturers but think about $200 oil and a FALLING $AUD. Sure as daybreak, if the US Fed collapses the $USD, oil will go polaric.

Force the $AUD down whilst Oil doubles and the next boom will be the noise accompanying the immolation of the Australian economy.

Leave it alone fools.

Friday, 15 June 2012

Aussie Mortgages American Style


Aussie sub-prime data came out few days ago and the results are shocking. The story, as it unfolds, won't be anywhere near the front page of the capital city Murdoch rags and probably not until its too late and the market is in free fall.

I've put the story in its entirety below, just in case someone at Murdoch realises the truth does not set you free, especially if you get the bulk of your revenue from advertising and real estate marketing.

Courts rule against lenders as boom-time low-doc loan frenzy unravels

SUBPRIME-STYLE lending practices were rampant during the last property boom despite claims by lenders that local practices were superior to global standards.

The Australian has exclusively obtained hundreds of internal emails between lenders and mortgage brokers that lift the lid on the extent of aggressive -- and in many cases predatory -- lending practices in the five years leading up to the global financial crisis.

The emails, many of which are from some of the biggest lenders to chains of hundreds of mortgage brokers, show some spruiked imprudent lending practices to mortgage brokers, highlighting loopholes in their own lending requirements. The practices, which have embroiled the likes of Macquarie Bank, Westpac and GE Money, as well as mortgage brokers in every state, underpin what is emerging as the Australian version of US subprime problems.
Indeed its not different here.

As with the boom-time predatory lending practices in the US -- which triggered the global financial crisis -- The Australian has found low-income earners, the elderly, pensioners and those with limited financial experience have been hit hard by the practices.

Thousands of such borrowers -- tens of thousands by some estimates -- were stung by abuse of low-documentation and no-documentation loans, which required little or no evidence of a borrower's income, but which usually were secured by a person's family home.
The emails show it was standard practice for many major banks and scores of non-bank lenders to aggressively spruik such loans to their mortgage brokers, which dealt directly with unsophisticated or "mum and dad" clients. So-called low-doc loans, created in the 1990s, were used by a very small niche of self-employed people who were unable or unwilling to provide financial information to their banks to secure a loan.

They were in many cases tax-avoiding small business owners who had not declared their full income to the Australian Taxation Office, but who could afford home loan repayments.
Its as American as case of Budweiser.

It remains unclear why the low-doc model became necessary in the 1990s, as banks had been successfully lending to businesses and the self-employed for hundreds of years.

By about 2004, with the arrival of the US mortgage securitisation model in Australia, led by Macquarie Bank, the use of such loans exploded, eroding the traditional relationship between lenders and borrowers.

The face-to-face contact with borrowers was conducted by mortgage brokers, which offered products through "mortgage aggregators" working for "securitisers" -- such as Macquarie Bank -- which packaged the loans and sold them to the eventual loan owner -- investors on international money markets.
Why? The same reason as the American one, GREED.

Mortgage brokers had little incentive to ensure borrowers were able to make repayments on loans, as it was not their money.

They had plenty of incentives to ensure loans were granted in the form of upfront commissions of 1.5-2 per cent of the value of every loan written -- about twice the rates earned by their counterparts in the US and Britain.
Twice the commission rate? 2% on a $400K loan is $8,000. Convince the victim to get another $100K and you get that nice round $10,000.

The initial "lender", the securitiser, also had limited incentive to ensure borrowers would be able to meet loan repayments in the medium term, as loans were quickly offloaded to investors in the booming market.

The low-doc and no-doc loans, which meant borrowers were not required to prove income or ability to make loan repayments, were perfect for such an environment, and were widely abused.
Moral hazard?

By the first quarter of 2005, about $500 million worth of low-doc loans were being written weekly in Australia, according to the Market Intelligence Strategy Centre, an analyst.

In the year to June 2007, $8.8 billion of low-doc loans were written. That had fallen to just $2bn in the year to June last year, according to the centre.
$500,000,000 a week??!!

During the boom, banks and non-bank lenders were eager to sign up low-doc loans, but apparently not directly, instead leaving that to mortgage brokers.
Got to keep the hands well away from the murder weapon. "I had no idea your honour, I've never even met him".
According to the centre, about 95 per cent of low-doc and no-doc loans were written by mortgage brokers during the boom years.

By contrast, about 40 per cent of full-doc, or standard loans, were handled by brokers in that time, according to the Mortgage and Finance Association of Australia.

Banks and non-bank lenders handled most of the more stable traditional full-documentation loans, but they left brokers, who were highly motivated to approve loans, to sell the vast majority of their high-risk low-doc product to small investors.
A nest of vipers.

Securitisers such as Macquarie Bank then packaged those low-doc loans and quickly sold them to international investors.
If the Americans can do it, we can as well.

Here is the shocker...

Fitch Ratings estimates low-doc and no-doc loans now represent 8-10 per cent of the $1.2 trillion national mortgage market. That's between $96bn and $120bn.

One in 20 loans held by the big banks is low-doc or no-doc, with the figure rising to about one in 10 across the market, as non-bank lenders hold the highest proportion of such loans.
$96B to $120B in sub prime?
It has now emerged it was standard industry practice for lenders to not even call potential borrowers to check whether they could afford to make loan repayments, or to ensure the information on loan application forms was correct.
I had to check that I wasn't reading that in a US newspaper.

A key to low-documentation lending was that borrowers were self-employed, as such it was originally required that such borrowers produce an Australian business number that they had used for at least three years.
An ABN is all you needed. No proof of income.
From about 2002, as brokers grew increasingly fat on high loan turnover and bankers rich from securitising loans, lenders began further untying the already extremely loose requirements of the low-doc loan. Emails obtained by The Australian show Macquarie, Suncorp, GE Money and RAMS Home Loans Lenders began saying people could access such loans if they had an "ABN for one day".


"Under the PUMA (Macquarie) loan, we will need ABN for one day, don't disclose any assets, liabilities or income, is that any good for you," mortgage aggregator AFG wrote in 2006.

In March 2008, as the global financial crisis was taking hold, Suncorp wrote: "Did you know that at Suncorp we offer a low doc loan up to 70 per cent loan to value ratio with no minimum period for holding an ABN?"

Some lenders went further, writing low-doc loans to borrowers who had provable pay-as-you-go taxable incomes.


In these cases, lenders asked borrowers what income they earned, but not for payslips, tax returns or group certificates to verify claims.


In the case of no-doc loans, borrowers were not even required to state any income.

In some cases, evident in emails obtained by The Australian, brokers who had submitted such information in applying for loans were asked to remove income-verifying documentation.

But not only were ABN restrictions watered down, the lending standards of almost the entire lending business were trimmed.
Banking 'code of conduct' appears to be an oxymoron.
Many banks were in breach of their own code of conduct.

According to the Australian Bankers Association's Code of Banking Practice, 2003, banks must ensure borrowers are capable of meeting loan repayments.

Section 25 of the code states: "Before we offer or give you a credit facility (or increase an existing credit facility), we will exercise the care and skill of a diligent and prudent banker in selecting and applying our credit assessment methods and in forming our opinion about your ability to repay it."

The emails uncovered by The Australian reveal this conduct requirement was widely flouted.

Of a low-doc loan, a Westpac "relationship executive" in the bank's "broker unit" wrote to one broker in February 2006: "It has to be stated what they (the borrower) earn etc on our calculator, but it's not a formal assets and liabilities statement from an accountant.


"We need to ask what they earn etc, but we take what they say without proof."
Well the game is up and the judicial system isn't playing the right ball.
In a series of precedent-setting legal cases, nine judges before six courts have found in favour of borrowers stung by lenders who failed to ensure borrowers were able to repay before writing a loan.

In almost all cases in which borrowers have lost some or all of the money borrowed, judges have overwhelmingly sided with borrowers and ordered mortgages be extinguished, or drastically reduced, within 30 days.

John O'Donnell and wife Jill were encouraged in 2002 by an unscrupulous mortgage broker to "unlock the equity" in their home by borrowing $500,000 against it, despite the couple earning just $23,000 a year.
Back in 2002 repayments on a $500,000 loan was  around $45,000 per annum. How do you pay that on $23,000 a year?
The property scheme collapsed and the couple faced repossession of their home, but the NSW Supreme Court ordered three-quarters of that loan extinguished because the couple could not afford the loan in the first place and the lender had engaged in "unconcionable" conduct.
Oh dear. The property scheme collapsed.
In response to borrower claims, some lenders have tried to distance themselves from low-doc lending procedures, stating mortgage brokers were responsible for checking whether borrowers could repay the loans.

Judges have rejected that claim, as has the ABA.

ABA chief executive Steven Munchenberg said it was OK for lenders to require mortgage brokers to obtain documents, but lenders were regardless required to independently verify such information and verify that borrowers could afford loans.

"Under the legislation and as a matter of common legal principle under the code, you are required to ensure that you have the information and that it is accurate," Mr Munchenberg said.

"Under existing law if it is established that a loan was made and a consumer could not comply with the terms without substantial hardship they could reopen and adjust that transaction. That law has been there since 1996."

Award-winning consumer advocate Denise Brailey of the Banking and Finance Consumers Support Association has, with The Australian, been closely following loan application irregularities for several years.

"But these emails prove unconscionable and predatory lending practices were happening across the board," Ms Brailey said.

She said she was in contact with more than 100 borrowers stung by predatory lending practices. Such borrowers came from every state and territory, as well as New Zealand, and they all had one thing in common.

She instructed the borrowers to contact their lenders and request copies of their loan application forms. "In every single case they have come back astounded," Ms Brailey said.

"Their incomes are vastly inflated and in most cases there are two, even three different sets of handwriting on the forms."

Other major concerns, which also point directly to imprudent lending, was the writing of 30-year loans to people in their 70s and 80s.

In May 2008, as the global crisis unfolded, Capital First wrote to one broker that "the maximum borrower age is now 70 years".

In the emails, lenders spruik to brokers the availability of "unregulated" loans.

That means loan application forms were ticked for "investment or business purposes" and so were not covered by national credit laws.

It is not clear whether such waivers actually remove a borrower's rights, but courts have to date indicated this is unlikely.
This has only just started and its going to get very interesting. The evidence and data presented clears away the last vestige of prudence regarding bank lending and the Australian Real Estate ponzi scheme that was borne around the time Howard came to power.

It will end badly just like the USA, Ireland and Spain. I wonder how long the main stream media can keep it under wraps? When you see it on TVFTFS (TV for the fucking stupid - eg 7,9 or 10 news, A Current Affair, Today Tonight etc) you know the game is up.

Saturday, 9 June 2012

RBA Governor Stevens' "Glass Half Full" Speech - The Party is Over!


Awesome speech. My estimation of the guy has gone up 500%. You can almost feel the ructions in the force and smell the property speculators soiling themselves.

There was an expectation by the herd (bordering on a perception of an unalienable right) that the Reserve Bank would keep the property bubble inflated even if it went to Zero Interest Rate Policy (ZIRP) and money printing. Well guess what? You're in trouble.

The speech is here: The Glass Half Ful (with graphs)

Excerpt:

But there is another aspect of the ‘multi-speed’ experience, which I suspect explains a good deal of the dissatisfaction we see, and it has to do with the behaviour of the household sector. Some parts of the economy that depend on household spending are still experiencing relatively weak conditions, compared with what they have been used to. But this isn’t because the mining boom spillovers have failed to arrive. It is, instead, the result of other changes that actually have nothing to do with the mining boom per se, but a lot to do with events that occurred largely before the mining boom really began.

The story is summed up in the two charts shown below. The first shows household consumption spending and income, both measured in per capita terms, and adjusting for inflation (Graph 2).[2] In brief, household spending grew faster than income for a lengthy period up to about 2005. The arithmetically equivalent statement is that the rate of saving from current income declined, by about 5 percentage points over that period.

It was no coincidence that households felt they were getting wealthier. Gross assets held by households more than doubled between 1995 and 2007. The value of real assets – principally dwellings – rose by more than 6 per cent per annum in real, per capita terms over the period (Graph 3).

Only a small part of this was explained by an increase in per capita expenditure on dwellings. The bulk of it came from rising prices. Moreover, a good deal of borrowing was done to hold these assets and household leverage increased. The ratio of aggregate household debt to gross assets rose, peaking at about 20 per cent. There was definitely a large rise in measured net worth, but relative to aggregate annual income, gross debt rose from 70 per cent in 1995, to about 150 per cent in 2007. Correspondingly, by 2007 the share of current income devoted to servicing that debt had risen from 7 per cent to 12 per cent, despite interest rates in 2007 being below those in 1995.

It is still not generally appreciated how striking these trends were. I cannot say that it is unprecedented for spending to grow consistently faster than income, because it had already been doing that for the 20 years prior to 1995. That is, the saving rate had been on a long-term downward trend since the mid 1970s. But it is very unusual in history for people to save as little from current income as they were doing by the mid 2000s. And it is very unusual, historically, for real assets per person to rise at 6 per cent or more per annum. It is also very unusual for households actually to withdraw equity from their houses, to use for other purposes, but for a few years in the mid 2000s that seemed to have been occurring.

Of course, Australia was not alone in seeing trends like this. There were qualitatively similar trends in several other countries, particularly English-speaking countries that experienced financial innovation. The international backdrop to this period was the so-called ‘great moderation’, in which there was a decline in macroeconomic variability. There were still business cycles but downturns were much less severe than in the 1970s or 1980s, inflation was low and not very variable, which meant that nominal interest rates also were generally low and not very variable, and compensation for risk became very modest.[3]

This ‘moderation’ came to an end with the crisis beginning in 2007. And with a few years of perspective, it is increasingly clear that Australian households began to change their behaviour at that time, or even a little before. The rate of saving from current income stopped falling probably around 2003 or 2004, and began to increase (we now know), slowly at first as the income gains from the first phase of the resources boom started in about 2005 or 2006, and then more quickly in 2008 and 2009.

Real consumption spending per head initially remained pretty strong in this period, reaching a peak in 2008. It then declined for a year or so, before resuming growth in the second half of 2009. That growth has, however, been much slower than had been observed previously. In the nearly three years from mid 2009 through to the March quarter 2012, real consumption per head rose at an annual pace of about 1½ per cent.

This is more than a full percentage point lower than the growth rate from 1995 to 2005. But this sort of growth is in fact quite comparable with the kind of growth seen in the couple of decades leading up to 1995. It is line with the quite respectable growth in income. But the gap between the current level of consumption and where it would have been had the previous trend continued is quite significant. If we then consider the growth of foreign online sales and so on, and the fact that consumers seem more inclined to consume services – experiences, as opposed to goods – we can see this is a significant change for the retail sector.

No doubt reinforcing this trend towards more circumspect, but more typical, behaviour is that the earlier strong upward trend in real assets per head has abated over recent years. In fact, real household assets per head today are about the same as they were five years ago, with a dip during the crisis, a subsequent partial recovery and then a slow drift down over the past couple of years. Both dwelling prices and share prices – the two really big components of wealth – have followed that pattern.

At some point, wealth will begin to increase again. After all, people are saving a reasonable amount from current income and placing the proceeds into various assets (especially, of late, deposits in financial institutions). That is, they are building wealth the old fashioned way. Ultimately these flows will be reflected in higher holdings of real and financial assets, at least once debt levels are regarded as comfortable. Asset valuation changes can of course dominate saving flows in shifting wealth over short periods and they are inherently unpredictable. So no one can predict the course of these measures of wealth over any particular short period. But wealth will surely resume an upward track, sooner or later.[4]

When it does, however, it is unlikely to be at 6 or 7 per cent per year in real, per capita terms. I would guess that over the long term, something more like 3 per cent would be nearer the mark.

I think this is a profoundly important point and worth emphasising. The decade or more up to about 2007 was unusual. It would be quite surprising, really, if the same trends – persistent strong increases in asset values, very strong growth in per capita consumption, increasing leverage, little or no saving from current income – were to re-emerge any time soon. That is, the gap between consumption today and the old trend level on the chart is not going to close. I noted to another audience about three years ago that the prominence of household demand in driving growth in the 1990s and 2000s was unlikely to be repeated.[5] If there were business strategies that assumed a resumption of the earlier trend, they will surely be disappointed in time, if they have not been already.

There were several parts of the economy that benefited from that earlier period, and that are finding the going much tougher now. Retailing was obviously one, but so was banking. Banks and other financial institutions enjoyed rapid balance sheet and profit expansion as they lent to households and some businesses. But they can see that period has now finished. Businesses that serviced rapid turnover in the dwelling stock (such as real estate agents, mortgage brokers) are seeing those revenue streams considerably reduced, and are having to adjust their strategies and capacity to suit changed conditions. For example, the rate of dwelling turnover is about one-third less than it was on average over the previous decade, and about half its peak levels. This is affecting state government stamp duty collections as well as the real estate sector.

We can also see some echoes of these changing trends in household demand in business investment spending.

This chart shows business investment, split into mining and non-mining, and measured in real, per capita terms, so as to be consistent with the earlier charts (Graph 4). Investment has been on a stronger upward trend since the mid 1990s than it had been for a number of years before that. In particular, business investment in real per capita terms has grown, on average, by over 6 per cent per annum since 1995, more than double the average pace over the preceding 35 years. Moreover a lot of this was in the non-mining sector, and it began before the present run up in mining investment really got going. Some of this growth reflected the same ‘consumer facing’ growth sectors mentioned above. Of the four sectors that had the fastest growing investment spending over that period, three were finance, one called ‘rental hiring and real estate services’, and retail trade. Some of these sectors are slowing their investment rates now.

Meanwhile, mining investment has recently been rising at an extraordinary pace. In 2005, mining investment was near its long-run average of around 2 per cent of GDP. By mid 2014 we expect it to reach at least 9 per cent of GDP. If that occurs, mining investment will be about as large as business investment in the rest of the private economy combined. As a result of that, total business investment will reach new highs this year, and next. Hence there is a very large build-up in the nation's capital stock occurring. If it is well managed and soundly based, that ought to allow the possibility of further growth in output and incomes. The investment phase of the mining boom will start to tail off in a couple of years' time, after which the shipments of natural resources should step up significantly.

We might expect by then as well that some other areas of investment spending that are weak at present will be picking up. More generally, I suspect we will discuss the nature of investment quite a bit in coming years as we grapple with structural change in the economy and powerful shifts in the population's needs (think of investment in the aged-care sector, for example, or public infrastructure needs). We will also be looking for productivity pay-offs from the various investments.

But the key message for today is that the multi-speed economy is not just about the mining sector squeezing other sectors by drawing away labour and capital and pushing up the exchange rate. It is doing that, but slower growth in sectors that had earlier done well from unusually strong gains in household spending would have been occurring anyway, even if the mining boom had never come along. It is these changes in behaviour by households, in asset markets and in credit demand, that I think lie behind much of the disquiet – dissatisfaction even – that so many seem to have been expressing. But this would, as I say, have occurred with or without the mining boom. In fact, without the mining boom and its spillovers, we would have been feeling the effects of those adjustments rather more acutely than we do now. The period of household gearing up could have ended in a much less benign way.

Implications for Policy

What are the implications of these trends for economic policy, and particularly monetary policy? Does it have a role in helping the adjustment?

One thing we should not do, in my judgement, is to try to engineer a return to the boom. Many people say that we need more ‘confidence’ in the economy among both households and businesses. We do, but it has to be the right sort of confidence. The kind of confidence based on nothing more than expectations of ever-increasing housing prices, with the associated willingness to continue increasing leverage, on the assumption that this is a sure way to wealth, would not be the right kind. Unfortunately, we have been rather too prone to that misplaced optimism on occasion. You don’t have to be a believer in bubbles to think that a return to sizeable price increases and higher household gearing from still reasonably high current levels would be a risky approach. It would surely be a false basis for confidence. The intended effect of recent policy actions is certainly not to pump up speculative demand for assets.[6] As it happens, our judgement is that the risk of re-igniting a boom in borrowing and prices is not very high, and this was a key consideration in decisions to lower interest rates over the past eight months.

Hence, I do not think we should set monetary policy to foster a renewed gearing up by households. We can help, at the margin, the process of borrowers getting their balance sheets into better shape. To the extent that softer demand conditions have resulted from households or some businesses restraining spending in an effort to get debt down, and this leads to lower inflation, our inflation targeting framework tells us to ease monetary policy. That is what we have been doing. The reduction in interest rates over the past eight months or so – 125 basis points on the cash rate and something less than that, but still quite a significant fall, in the structure of intermediaries' lending rates – will speed up, at the margin, the process of deleveraging for those who need or want to undertake it.

In saying that, of course, we cannot neglect the interests of those who live off the return from their savings and who rightly expect us to preserve the real value of those savings. Popular discussion of interest rates routinely ignores this element, focusing almost exclusively on the minority of the population – just over one-third – who occupy a dwelling they have mortgaged. The central bank has to adopt a broader focus. And to repeat, it is not our intention either to engineer a return to a housing price boom, or to overturn the current prudent habits of households. All that said, returns available to savers in deposits (with a little shopping around) remain well ahead of inflation, and have very low risk.

So monetary policy has been cognisant of the changed habits of households and the process of balance sheet strengthening, and has been set accordingly. As such, it has been responding, to the extent it prudently can, to one element of the multi-speed economy – the one where it is most relevant.

What monetary policy cannot do is make the broader pressures for structural adjustment go away. Not only are the consumption boom and the household borrowing boom not coming back, but the industry and geographical shifts in the drivers of growth cannot be much affected by monetary policy. To a large extent, they reflect changes in the world economy, which monetary policy cannot influence. Even if, as a society, we wanted to resist the implications of those changes other tools would be needed.

In fact Australia does better to accommodate these changes, and to think about what other policies might make adjustment less difficult and quicker for those adversely affected. It is in this area, in fact, that we need more confidence: confidence in our capacity to respond to changed circumstances, to respond to new opportunities, and to produce goods and services which meet market demands. It is also to be hoped that some of the recent positive data outcomes will give pause to reflect that, actually, things have so far turned out not too badly.

Key Points:

Trend data
  • Household spending grew faster than income for a lengthy period up to about 2005
  • Households felt they were getting wealthier
  • Gross assets held by households more than doubled between 1995 and 2007. The value of real assets – principally dwellings – rose by more than 6 per cent per annum in real, per capita terms over the period (John Howard's bubbliciously prosperous years)
  • Only a small part of this was explained by an increase in per capita expenditure on dwellings. The bulk of it came from rising prices
  • Borrowing was done to hold these assets and household leverage increased
  • The ratio of aggregate household debt to gross assets rose, peaking at about 20 per cent
  • There was definitely a large rise in measured net worth, fuelled by debt (if I hear one more lemming say "I've had success with property", I'm getting a gun licence - EVERYBODY got ahead)
  • Relative to aggregate annual income, gross debt rose from 70 per cent in 1995, to about 150 per cent in 2007 (but Peter Costello was the world's greatest treasurer, you mean were just doubled the credit limit and felt richer?)
  • By 2007 the share of current income devoted to servicing that debt had risen from 7 per cent to 12 per cent, despite interest rates in 2007 being below those in 1995

An aberration
  • It is still not generally appreciated how striking these trends were (the Wildebeeste mated with an Ostrich factor)
  • It is very unusual in history for people to save as little from current income as they were doing by the mid 2000s
  • It is very unusual, historically, for real assets per person to rise at 6 per cent or more per annum
  • It is also very unusual for households actually to withdraw equity from their houses, to use for other purposes, but for a few years in the mid 2000s that seemed to have been occurring (PONZI cash in !!!)

Global banking
  • Australia was not alone in seeing trends like this. There were qualitatively similar trends in several other countries, particularly English-speaking countries that experienced financial innovation (Ireland, UK and USA)
  • Taking risks became almost risk free

Savings, consumption and reality
  • The rate of saving from current income stopped falling probably around 2003 or 2004, and began to increase (we now know), slowly at first as the income gains from the first phase of the resources boom started in about 2005 or 2006, and then more quickly in 2008 and 2009 (borrow and speculate in a Ponzi scheme and use the gains to spend)
  • Real consumption spending per head initially remained pretty strong in this period, reaching a peak in 2008
  • It then declined for a year or so, before resuming growth in the second half of 2009 (GFC then Rudd stimulus and FHOG grants boosting home equity)
  • In the nearly three years from mid 2009 through to the March quarter 2012, real consumption per head rose at an annual pace of about 1½ per cent  (home quity ATM is 'out of service')
  • This is more than a full percentage point lower than the growth rate from 1995 to 2005. But this sort of growth is in fact quite comparable with the kind of growth seen in the couple of decades leading up to 1995. It is line with the quite respectable growth in income
  • The gap between the current level of consumption and where it would have been had the previous trend continued is quite significant  (party is over! bar is closed!)

Pop goes the bubble
  • Real household assets per head today are about the same as they were five years ago, with a dip during the crisis, a subsequent partial recovery and then a slow drift down over the past couple of years. Both dwelling prices and share prices – the two really big components of wealth – have followed that pattern (its effectively 2007, FIVE YEARS OF GAINS ARE GONE!!! How far back will we go?)

The glimmer of the false dawn?
  • At some point, wealth will begin to increase again (When? At least 6 years from 2009 peak?)
  • After all, people are saving a reasonable amount from current income and placing the proceeds into various assets (especially, of late, deposits in financial institutions). That is, they are building wealth the old fashioned way
  • Ultimately these flows will be reflected in higher holdings of real and financial assets, at least once debt levels are regarded as comfortable (It won't fall forever and there will be a bottom, though the Irish, Spanish and Americans etc are still waiting for theirs. Mariana's Trench is 35,800ft deep but it does have a bottom!)
  • The RBA can't predict the course of these measures of wealth over any particular short period. But wealth will surely resume an upward track, sooner or later (Japan is near the bottom 22 years from the top)

When the party starts again, the bar will be closed and its square dancing only
  • When it does bottom future gains are unlikely to be at 6 or 7 per cent per year in real, per capita terms. I would guess that over the long term, something more like 3 per cent would be nearer the mark (CPI gains only - the doubling every 7 or 10 years bullsh*t is OVER!!)
  • The decade or more up to about 2007 was unusual (lets call it the Howard Era or GADO period - Greed And Debt Orgy)
  • It would be quite surprising, really, if the same trends – persistent strong increases in asset values, very strong growth in per capita consumption, increasing leverage, little or no saving from current income – were to re-emerge any time soon
  • The prominence of household demand in driving growth in the 1990s and 2000s was unlikely to be repeated
  • If there were business strategies that assumed a resumption of the earlier trend, they will surely be disappointed in time, if they have not been already

Who needs to seriously look at alternative career options
  • There were several parts of the economy that benefited from that earlier period, and that are finding the going much tougher now. Retailing was obviously one, but so was banking. Banks and other financial institutions enjoyed rapid balance sheet and profit expansion as they lent to households and some businesses. But they can see that period has now finished  (FINITO!!)
  • Businesses that serviced rapid turnover in the dwelling stock (such as real estate agents, mortgage brokers) are seeing those revenue streams considerably reduced, and are having to adjust their strategies and capacity to suit changed conditions
  • For example, the rate of dwelling turnover is about one-third less than it was on average over the previous decade, and about half its peak levels
  • Low turnover is affecting state government stamp duty collections as well as the real estate sector (they'll slash the public service, scrimp on infrastructure and get their debt ratings downgraded)
  • We can also see some echoes of these changing trends in household demand in business investment spending
  • Of the four sectors that had the fastest growing investment spending over that period, three were finance, one called ‘rental hiring and real estate services’, and retail trade. Some of these sectors are slowing their investment rates now
  • The investment phase of the mining boom will start to tail off in a couple of years' time
  • The multi-speed economy is NOT about the mining sector squeezing other sectors by drawing away labour and capital and pushing up the exchange rate
  • Slower growth in sectors that had earlier done well from unusually strong gains in household spending (fuelled by house price rises) would have been occurring anyway, even if the mining boom had never come along
  • The Changes in behaviour by households, in asset markets and in credit demand, that lie behind much of the disquiet – dissatisfaction even – that so many seem to have been expressing stems from the lack of home equity growth (disquiet? Some are sh*tting themselves on realising it was just a Ponzi scheme)

All bubbles burst and the RBA will not reinflate Australia's
  • Without the mining boom and its spillovers, we would have been feeling the effects of those adjustments rather more acutely than we do now
  • The period of household gearing up could have ended in a much less benign way (its not over Glenn, its only starting)
  • The RBA should not do try to engineer a return to the boom (come on Glenn, stop f*cking around, call it a bubble)
  • Many people say that we need more ‘confidence’ in the economy among both households and businesses. We do, but it has to be the right sort of confidence
  • The kind of confidence based on nothing more than expectations of ever-increasing housing prices, with the associated willingness to continue increasing leverage, on the assumption that this is a sure way to wealth, would not be the right kind

Herd theory, naivety and stupidity
  • We have been rather too prone to the misplaced optimism on the expectation of ever increasing house prices (Wildebeeste factor)
  • You don’t have to be a believer in bubbles to think that a return to sizeable price increases and higher household gearing from still reasonably high current levels would be a risky approach and a false basis for confidence
  • The intended effect of recent policy actions is certainly not to pump up speculative demand for assets. The risk of re-igniting a boom in borrowing and prices is not very high, and this was a key consideration in decisions to lower interest rates over the past eight months (start bubbling again and UP those interest rates will go!!)

RBA policy on the indebted and savers and re affirming the party is over
  • Inflation targeting framework sets monetary policy. The reduction in interest rates over the past eight months or so – 125 basis points on the cash rate and something less than that, but still quite a significant fall, in the structure of intermediaries' lending rates – will speed up, at the margin, the process of deleveraging for those who need or want to undertake it (don't take on more debt, pay down the loans you have)
  • The RBA cannot neglect the interests of those who live off the return from their savings and who rightly expect us to preserve the real value of those savings (this is important, the RBA will NOT go to zero rates, returns on deposits are important)
  • Popular discussion of interest rates routinely ignores savers, focusing almost exclusively on the minority of the population – just over one-third – who occupy a dwelling they have mortgaged
  • The central bank has to adopt a broader focus and it is not the intention either to engineer a return to a housing price boom, or to overturn the current prudent habits of households (keep saying it Glenn and the Wildebeeste may listen)
  • Returns available to savers in deposits (with a little shopping around) remain well ahead of inflation, and have very low risk
  • Monetary policy has been cognisant of the changed habits of households and the process of balance sheet strengthening, and has been set accordingly
  • It has been responding, to the extent it prudently can, to one element of the multi-speed economy – the one where it is most relevant.
  • Monetary policy cannot make the broader pressures for structural adjustment go away (ie the recessions you HAVE to HAVE in a market economy)
  • The consumption boom and the household borrowing boom not coming back (keep saying it Glenn and the Wildebeeste may listen)
  • Industry and geographical shifts in the drivers of growth cannot be much affected by monetary policy. To a large extent, they reflect changes in the world economy, which monetary policy cannot influence. Even if, as a society, we wanted to resist the implications of those changes other tools would be needed (ie in case of a mining slowdown due China's hard landing and/or Euro/USA meltdown)
Well that sucks. No more risk free real estate to riches schemes. Baby boomers with investment properties are going to jump? First in best dressed or hope to hell and hang in there?

Don't you just hate waking up the day after a crazy party, one that you thought would never end?


Tuesday, 1 May 2012

The RBA Have Hit The Button


Wow. Fear and Panic. Smell it.

RBA's 50-point rate cut shot in arm for non-mining economy

Non-mining economy? That other bit that measures 85% of Australia's GDP (the non-mining sector)?  The 98.2% of Australian workers not employed in mining? I thought it was a mining boom and Australian's benefited?

You have to laugh. No one saw this coming did they (Smells Like?)

David Collyer picked up on an interesting wee morsel last month that the media chose to ignore and bury (so they don't spook the herd), What a party; what a hangover!


The RBA said yesterday assets have fallen by $40,000 per household in the last year. 

What about the mining boom? The Ponzi scheme starts to unravel. $40K south in one year? Grab the popcorn.

No wonder everyone is now saving over ten percent of their incomes and slashing mortgage balances with grim determination.

The economy, which usually steers like an oil tanker, has turned on a dime.

We were spending about 103 per cent of incomes, pinching off some of the strong rises in home prices and balancing this with borrowings.

What happened? Falling land prices.

103% of incomes? What could possibly go wrong in an economy that relies on a property bubble and more debt for growth?

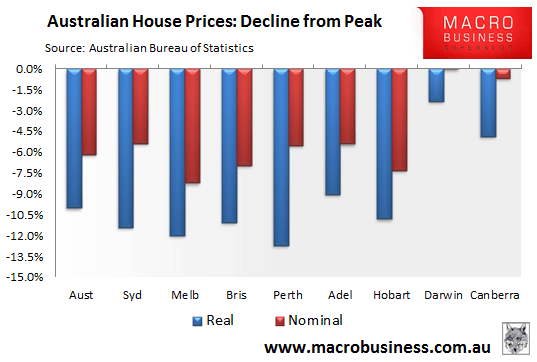
The ABS says house prices are down nationwide by a mere 4.8 per cent (ABS). This is the result.

ABS horseshit. The fact is you can drop your 2009 peak valuation by 15% and you won't get a buyer.

ABS stats from MacroBusiness


The magic number is 1.15% . Drop house prices by 1.15% per month and in 5 years they have halved in value, not allowing for inflation. The beauty of 1.15% is that the herd is by and large so stupid and sans a mathematical clue it appears to be an insignificant number to be ignored. That own goal is scored a lot sooner if we take the stagflation pill.

Now lets see what interest rate the banks pass on? My bet is very little as they need my deposit capital more than ever.

However, my bet shorting the AUD yesterday is off to the races. Fallen now 1.2% in 32 hours or 120% return on margin. Thanks Glenn.

RBA Links:
http://www.rba.gov.au/publications/fsr/index.html
http://www.rba.gov.au/publications/bulletin/2012/mar/3.html


Friday, 23 March 2012

An Epic Australian Bust


A link well worth a read from Seeking Alpha. Some superlative graphs and analysis.

An Epic Australian Bust

The reality is starkly different: Australia has a very vulnerable economy where upcoming bad news has not been "priced in" at all. The country suffers from an epic real estate bubble that greatly exceeds those of US, Ireland, and Spain. The average Australian consumer is completely tapped out. Take out a "consumer credit" punchbowl and reduce the Chinese voracious appetite for iron ore and coal, and the Australian economy will collapse like a house of cards.
Australian manufacturing has been declining in relative and absolute terms at a faster rate than it is in the USA and Europe. Today, it imports most of its manufactured goods.At first glance, exports are only a modest 21% of GDP compared to over 30% for other G20 countries such as Germany, China, and Canada. About 57% of all exports are minerals and agriculture, a highly sensitive sector prone to wild supply/demand and price fluctuations

Wednesday, 1 February 2012

Australians, Grab A Paddle!


In an attempt to quash the myths surrounding mining and its effects on the economy, last year I wrote Mining The Truth - Absolute Power Absolutely or 730,000% ROI over 10yrs and I'm not going to go over all the data again, you can visit the link.


But, I notice that The Treasurer has eased up on the 'Australia is safe it has 'mining waffle and is now talking up the banks, low federal debt etc and encouraging private spending.

Why is that? He has seen (advised more likely, I doubt he can see shit from clay, ditto Hockey) how totally exposed Australia is and can't afford to wait for something to happen. As an example see Macrobusiness here.

How exposed?

  • Household debt is a smidge under 100% of GDP at $1.365Trillion (mostly mortgage debt, see bottom point).
  • Whilst Federal Govt debt is relatively low (compared to other G20 nations), private foreign debt (ie banks funding from overseas to feed the housing bubble) is $765Billion.
  • Mortgage (Owner occupier and Investor) debt (the Achilles heel) is $1.23Trillion*.


*When the Howard govt took office mortgage/housing debt was a mere $186Billion, it increased 5 fold in 11 years to $939Billion as debt was thrown at Australians like confetti, and the Dwarf and the Smirking Gonad repeatedly convinced Australians that  Debt=Wealth  and instead of doing something productive with the debt, went along the path of vying with Ireland to see who can creating the biggest property bubble in the history of the world.


If the Australian 'economy (*cough* aka debt fuelled Ponzi scheme) is $1.4Trillion and exports of Iron, Coal, Gold, Natural Gas and Oil only account for less than 10% of GDP, where is economic activity and why is the treasurer worried?

Services. The Wiki definition:

The tertiary sector of the economy (also known as the service sector or the service industry) is one of the three economic sectors, the others being the secondary sector (approximately the same as manufacturing) and the primary sector (agriculture, fishing, and extraction such as mining).

The service sector consists of the "soft" parts of the economy, i.e. activities where people offer their knowledge and time to improve productivity, performance, potential, and sustainability. The basic characteristic of this sector is the production of services instead of end products. Services (also known as "intangible goods") include attention, advice, experience, and discussion. The production of information is generally also regarded as a service, but some economists now attribute it to a fourth sector, the quaternary sector.

The tertiary sector of industry involves the provision of services to other businesses as well as final consumers. Services may involve the transport, distribution and sale of goods from producer to a consumer, as may happen in wholesaling and retailing, or may involve the provision of a service, such as in pest control or entertainment. The goods may be transformed in the process of providing the service, as happens in the restaurant industry. However, the focus is on people interacting with people and serving the customer rather than transforming physical goods.


70% of Australian economy is powered by 'services'. 70% of The Australian economy is driven by: Buying and selling crap to each other; Going out for a Latte; Getting someone to cut your lawn etc etc.

The governments of the last 16 years (AK, After Keating) are even proud of it:
DFAT: [Australia's]Service sector—world class tertiary industries

Australia has a competitive, world-class service sector that is underpinned by a skilled, multilingual workforce, a stable liberal democratic political system, a strong economy, and proximity to the major financial markets of Asia.

The service sector—or tertiary economy—accounts for 70 per cent of the country’s economic activity. It includes: banking, insurance and finance; the media and entertainment industries; consulting, tourism and retail; services provided by government, such as education, health and welfare; and other personal and business services.
If only 1.8% of the workforce is employed by Mining, what sector employs the most?

Australia has a well-developed tourism industry that welcomes more than five million visitors to the country each year and contributes around $20 billion to the economy annually. Additionally, Australians spend annually around $60 billion on domestic tourism, making 208 million trips in 2006–07. Overall, tourism accounts for 3.9 per cent ofgross domestic product. The industry employs 464 500 people nationally, or 4.5 per cent of the total workforce.

The retail industry is the largest employer in Australia, accounting for 920 000 jobs, or 12 per cent of the workforce. It typically accounts for around $150 billion in transactions annually. The majority of workplaces in the sector employ fewer than 20 people. The larger retail stores are mainly sellers of clothing and soft goods, supermarkets or grocery stores, and department stores. Around 44 000 of the people employed in the industry are working proprietors and partners.

The Australian food and beverage industry is recognised worldwide for its variety, high quality, healthy image, innovative manufacturing and packaging technologies. The diversity of foodstuffs available from Australia is huge and comprises grains, meats, dairy products, seafood, fruit and vegetables, bakery goods, olive oil, wine and other beverages, and confectionery, plus a host of individual gourmet treats and specialty lines.
12% of the workforce employed in retail, our biggest employment sector.

Can anyone see a problem? Since Paul Keating lost the 1996 election, 11 years of Liberal government and 4 years of Labor government, made Australia's economy into a giant Ponzi scheme.
  1. Banks borrow heavily from overseas and create and feed a Property boom (bubble) through easy credit.
  2. As new entrants into the scheme borrow more heavily believing the 'shortage' myth/scam and 'get in on the property ladder' bollocks, earlier entrants get rising home equity (as all Ponzi schemes work).
  3. This equity is used to buy, buy, buy, and spend, spend, spend on all sorts of retail junk, take holidays, cars, etc
  4. What happens to Ponzi schemes when you get no new entrants and the easy lending is tightened is simple: the schemes collapse, like the US and Irish property bubbles.

Can you see The Nurse and the Cop continuing to join the scheme until all their pay cheques go to (houses to $1M in 7 years bullshit) debt repayment? 

If home equity continues to fall at current rates and spending dries up at current rates what happens to that 'service' sector where 12% of Australia's employed are in retail, most of which are in businesses with less than 20 employees?

When those 'service' industries and shops start to lose money what happens to employment?

When unemployment climbs what happens to the housing Ponzi scheme?

This situation was obvious last year...Smells Like?

The USA, Housing vs Unemployment


Its easy to blame Greece etc and a Greek default will freeze money markets but Australia's woes were 16 years in the making and were spawned when you still paid for your Ouzo in Drachmas in downtown Athens.


Tuesday, 24 January 2012

The IMF Has A Peek At Australia


First Moody's waving warning flags and now the IMF. In The Australian, Australian banks should hold more capital: IMF.

A STUDY by the International Monetary Fund is urging Australian banks adopt tougher capital requirements in case of a collapse in the country's property market. (aren't we different here?)

"Combining residential mortgage shocks with corporate losses expected at the peak of the global financial crisis would put more pressure on Australian banks' capital. Therefore, it would be useful to consider the merits of higher capital requirements for systemically important domestic banks," said the IMF paper made public today.
Banks continue to face concerns from global investors about the prospect for Australia's mortgage market after a broad decline in home prices last year.

According to the IMF paper, the banks' main vulnerability is their exposure to a highly indebted households through residential mortgage lending. Together, Australia's four largest banks hold more than 80 per cent of Australia's mortgages on their books.
Even so, the IMF paper said a stress test of the banking system based on the Irish experience showed banks could withstand "sizeable shocks to their exposure to residential mortgages". 
The IMF is now comparing Australia to Ireland?

The document is embedded below. I love this bit...
“The full recourse nature of mortgage lending also helps limit strategic loan defaults.”
If you are wondering where Crockett and Tubbs fit,  Florida has full recourse loans, a sought after location and people flocking their in droves. They were resilient in the midst of the downturn  right?

Miami's Vice


 Bank Capital Adequacy Australia 2012

Australia Now Driving On The Negative Equity Super Highway, Route 1 To Financial Perdition


Take the next right and let the journey begin...


Lots of articles appearing  in the media about negative equity and shattered housing dreams.

Local owners looking at negative equity 

The latest RP Data National Equity Report indicated that almost the entire area located to the east and south of Perth, effectively from Perth down to Albany and across to Esperance, was experiencing some of the nation’s highest levels of negative equity.

Report authors and RP Data researchers Tim Lawless and Cameron Kusher said that almost 5 per cent of homes nationwide were in negative equity.

“4.9 per cent of all Australian homes are currently valued at less than purchase price,” the report said.“The negative equity figure has risen from 3.7 per cent at the end of the last quarter.”

The report cited far north Queensland, the Gold Coast and the Sunshine Coast as having the highest instances of negative equity at 20.2 per cent, 14.0 per cent and 13.5 per cent respectively.
20.2% of Far North Queensland homes are in negative equity? 
14% on the Gold Coast?
13.5% of Sunshine Coast Properties? 
4.9% Nationally?

Thats a train wreck.

And, it will only get worse. Unemployment is still under 5.5%, wait until its over 10%. And, it will go there as the domestic purse strings tighten with falling home equity and the spiral begins. I wrote Smells Like? as the first evidence of retail contagion started to surface last year and it appears that indeed its not different here.

More Links: 


Jesse's Holiday Season Award For A Journalist Putting 24Karat Gold Coating On a Dog Turd:

1770 prices step back in time as beach towns await boom 
The reality is the banks are dumping their foreclosures.

According to Ms Skinner, the once $1.5m-$1.8m asking prices for beachfront penthouses at Loka Santi have slumped to a more realistic $350,000-$600,000. The average median house price in Agnes Water has slumped 20 per cent compared with the same time last year, according to RP Data.

Ms Skinner should know. Two years ago she paid $900,000 for a garden unit in the same block in which the penthouse was surrendered by the bank at a knock-down price. "It brought tears to my eyes," she said.

And, The Nice Try But Fail Award (One can still smell the odoriferous tang of dog faeces despite appearances):

Chinese lead increase in foreign investment in Queensland residential property in 2011

And buyers from China once again topped the list, according to new research by Colliers International.

The figures on buying patterns during the 2010-2011 financial year have shown 733 residential sales to foreign buyers.

In all, 506 of those sales were investments with 277 for owner-occupiers.
While overseas buyers eased back on spending, it was not at the same level of decline as local buyers.

Buyers from China actually stepped up their spending. They forked out $106.8 million on Queensland property - an increase of 50 per cent on last year.

733 sales to foreigners out of  over 100,000 sold across the state? Whats that under 0.7%? Not even 1% of QLD property goes into foreign hands and its a story? Of that 733 minutae, the Chinese bought 32% or 234 properties worth $106.8M or, $462K a property. Wow, we are saved.

Its worth following Michelle Hele at The Courier Mail, she is hilarious. Tasmania Real Estate Trouble first outed her in Yes, we are open!. This country badly needs an Australian Real Estate "Shill Tracker".

So where to from here?

Lets look to those silly Americans who nothing about exuberant bank lending and real estate crashes.

14.7 Million (19%) Of US Mortgages Have $770 Billion In Underwater Equity, $2.4 Trillion In Total Debt Impaired (This article is 18 months old but you'll get the picture)

I don't understand why Florida and California lead the pack, wasn't there a housing shortage there in 2006?
Southern California has been experiencing a massive population boom in recent years and it’s believed that 6 million new residents will be living in the region by 2020. The population increase, coupled with the housing shortage, has the CBIA worried that it will be increasingly difficult for first-time homebuyers to find a moderately priced unit

Hows it going 5 years on?
Case-Shiller Report… Housing Pain Remains

The Case-Shiller indices indicate a couple of things. First, the impact of foreclosed properties still weighs on home prices. And as more foreclosed properties hit the market now that lenders are ending their self-imposed moratorium on foreclosures, more pressure is expected on home prices.

As we take the exit, I check the NavMan to see exactly where we are...


Whats on the horizon to turn this baby around? Nothing.

If anything, external factors (China and Europe) will add a Nitrous Injection to the engine.

Tuesday, 3 January 2012

What Will 2012 Bring?


So, now the hangovers have abated, what will 2012 bring?

Marcus Padley
I'll start with a broker I thoroughly respect, Marcus Padley (writes for Fairfax etc), who appears who made some predictions whilst having a few beers pre-Christmas.

Headlines you may see in 2012 
  • ANZ raises interest rates 100bp at monthly monetary policy meeting. Declares interest rate settings “appropriate for our shareholders” and “profit margins within target band”
  • RBA closed. Glenn Stevens joins Macquarie
  • Westfield charges Retailers $10,000 per square megabyte on New Westfield Virtualand website
  • Gerry Harvey declares the internet a ‘fad’
  • Mercedes Benz prices jump 218% on euro break up. German exports fall 98% Greek Drachma jumps 14% to 0.0002374 Deutschmarks as faceless EU plant retires from post as Greek Prime Minister aged 45 on seven eighths of his final two years salary plus benefits
  • German taxi driver earns 10 times as much as new Greek PM
  • Rogue Trader at Goldman Sachs makes $US100bn profit shorting euro. Joins Cramer’s White House Administration as US Treasury Secretary
  • Berlusconi releases second Love Song CD “Don’t cry for me Angela Merkel, you know the truth is, I never loved you. All through my wild days, my mad existence, I knew the euro, wouldn’t go the distance”


...etc. Read the rest in the link, its quite amusing.


His 2011 predictive history sans beer (I assume) is worth a read, he is rather good... Let's share the financial obvious with hindsight. If you like what you read you can sign up for a free weeky newsletter at the bottom of this page: Marcus Today. Also a free end of day report here.

Art Cashin
Art is a 40 year trading veteran on the floor of the NYSE working for UBS.

Art Cashin of UBS

Europe Rumbles Continue Beneath More Upbeat Headlines - Ever since last week’s liquidity operation, most headlines out of Europe have leaned toward the reassuring side. Beneath those headlines, however, there are signs the strains remain and may, in fact, be growing.

European banks are making great use of the ECB’s overnight deposit facility. Last night they parked $590 billion at the ECB breaking the record they had set the night before. They are clearly unwilling to lend to other European banks, highlighting the distrust and fear in the interbank marketplace. While the ECB’s lending initiative calmed the markets somewhat, it apparently has done nothing to free up the logjam blocking interbank lending.

The distrust on the streets is said to be growing also. Barroom gossip says that safe-deposit boxes are in a demand that borders on frenzy. They allow you to take your Euros and covert them into something of value (gold, Swiss Francs, etc.) and sock it away in a safe place. Others are said to be buying property in London and elsewhere lest you awake one day and discover that your Euros have reverted to drachmas or lira.

Savvy bankers are said to be setting up personal and communal trusts domiciled in places like the Bahamas, the Caymans or the Isle of Jersey. Some banks are offering depository accounts denominated (and repayable) in alternate currencies like the dollar or the yen.

We think a Lehman-like event would most likely be triggered by a run on a bank or a series of banks. The scramble for currency (value) protection among the public could turn into that bank run in the same way that a crowd can instantly turn into a mob. Watch the money flows out of Greece and Italy very carefully. The pot continues to bubble.

Outflows From Italy and Greece


Max Keiser (the irrepressible!)


My Predictions
  • At least one Eurobank will fail as capital flight from the PIIGS increases in intensity. (Capital flight occurring now, banks insolvent and on ECB life support)
  • Credit contagion and freeze. (TED Spread, Euribor etc rising now)
  • Crash of various debt fuelled asset classes. (Stocks, property easing as credit freezes, economies stall and UE climbs are occurring now)
  • China's manufacturing sector continues to contract (now 2 months running), their housing and debt sector collapses. (happening now at a rapid rate)
  • Japanese economy on the verge of collapse as Yen reaches all time high.(happening now, this year they borrowed more than tax revenue for the first time)
  • ASX will see 2xxx (Eurobank failure - replay of 2008)
  • Unemployment in Oz 9% and rising (rising now as property prices fall)
  • Australian bank profits turn to losses ala USA, Ireland, Britain etc with abysmal outlook for 2013 as another 8-10% wiped off house prices.(outcome of Property Prices falling another 8-10% plus credit freeze)
  • 40% of Americans and 8% of Australians have 'underwater mortgages' or negative equity.(outcome of Property Prices falling another 8-10%)
  • US Debt over $17 trilion (thats a gimme)(based on last 3 years debt growth and Obama's debt addiction and election year)
  • Gold over $2500 USD as QE3 is triggered following a late 2008 NYSE -30% replay, which puts a boost under stockmarkets, but little else as US unemployment U3 nudges 12% . (based on late 2008, early 2009)
  • Australia's Deficit increases as tax revenues dwindle (outcome of Property Prices falling another 8-10% and UE rising, CGT and PAYG revenues falling)
  • Australian states get credit downgrades as the stamp duty money flow slows to trickle and their in massive deficits leading to massive cuts in state public servants. (outcome of Property Prices falling another 8-10%, Stamp Duty revenues dwindle)
  • If Ron Paul doesn't get GOP nomination, No Hope Obama hits the front. (coin flip)
  • AUD breaches 75c.(based on late 2008, early 2009 carry unwind, Risk OFF)
  • Coin toss on Iran invasion as China declares alliance. (historical friendship established a long time ago, google it)
  • Russia continues to take a more aggressive and militaristic stance towards the west with a possible China alliance (enemy of my enemy is my friend). (occurring now)
  • Civil unrest climbs in the PIIGS and UK - soldiers used to keep it under control as civil war draws closer as unemplyment climbs, credit is frozen and austerity creates a depression.(starting to occur now as austerity bites)
  • Le Pen and the far right take more dominant positions in France if not president Le Pen (starting to occur now)


On China/Iran and Russia/West (videos in links):
China to Protect Iran Even if Result Starts World War III

Russia Retaliates Against US: Puts Radar Station On Combat Alert, Prepares To Take Out European Missile Defense Systems


HAPPY NEW YEAR!!